A Dynamic Drop into Support for Strong Trender Disney DIS
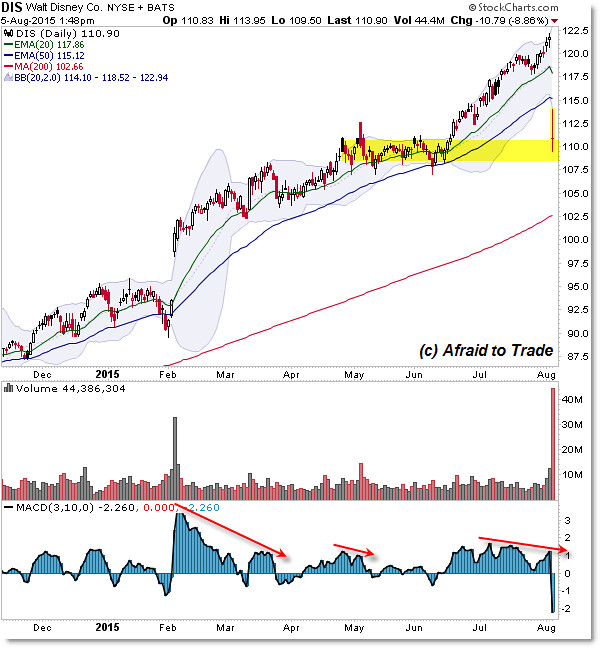
Not to be outdone by Apple’s (AAPL) big gap into support yesterday, strong trending stock Disney (DIS) disappointed investors and dropped straight into a key support reference level.
Let’s update our Disney (DIS) chart, learn a quick lesson, and plan the next move for this big stock.
We’ll start with the Daily Chart:

First, take a moment to review yesterday’s update on Apple which is similar to Disney (DIS) here.
Disney is (was) a strong trending stock that repeatedly showed up on our trending stock scans as the extended uptrend continued higher and higher.
Our principle states “Stocks which are strong tend to get stronger” and Disney was a textbook candidate of this investment and trading principle.
However, Disney currently teaches us that we can’t become complacent in our activities – trade management is active management.
Note each time price – in the ongoing uptrend – formed a lengthy negative momentum (and volume) divergence with price.
Each time as highlighted, price pulled back (retraced) down from a high.
In other words, though the trend may be up, we need to take profits or become cautious during a period of extended negative divergence (at a new price high).
The snap-back gap that occurred today is rare but it’s certainly enough to get our attention to study this example and prepare for the future.
With the lesson behind us, what’s the current expectation for price?
Note the highlighted area – the consolidation – and how it has become our current focal point.
The $110.00 per share region should be seen as the current (potential) support-bounce pivot from which to plan either a bullish bounce (aggressive support) trade… or a sell-swing continuation of the liquidation.
Let’s get a little more specific with our planning by using a Fibonacci Confluence Grid:

I drew three Fibonacci Grids from three price swing lows to the recent swing high into $122.00 per share.
We’re only interested in the close overlaps (clusters) of main Fibonacci Retracement levels.
For example, price gapped – and could support-bounce – straight into the $110.00/$111.00 overlap as noted.
Price is bullish as it moves “up away from” this pivot level.
But what if instead sellers continue their campaign?
Then the next downside target is the price and 61.8% target near $108.00 per share.
Beneath that is the more important level where two grids overlap $106.00 per share.
Ignore the other levels and focus on these for planning a bounce scenario… or a sell-swing play if price returns under $110.00.
Follow along with members of the Afraid to Trade Premium Membership for real-time updates and additional trade planning.
Corey Rosenbloom, CMT
Afraid to Trade.com
Follow Corey on Twitter: http://twitter.com/afraidtotrade
Corey’s book The Complete Trading Course (Wiley Finance) is now available along with the newly released Profiting from the Life Cycle of a Stock Trend presentation (also from Wiley).


It is definitely crucial to work with support zone, it can bring serious levels of profits, but one has to be careful with the money management, if that’s done right then it’s really good opportunity to make serious amount of profits, but of course if we are unable to do this right then we are going to struggle. I am lucky that I am having world class platform like cTrader, it’s best for analyzing and is provided by OctaFX broker, it’s a multiple award winning broker!
We need to be very careful when trading on these support and
resistance method, it can easily leave us in no man’s land, I am trading with
OctaFX broker where they have outstanding setup with having 50% bonus on
deposit, so that really helps me trade with very low fear and risk which is
something i enjoy and always get better chance of profits without having to
face much trouble at all in any situation at all which makes me love it even
more.