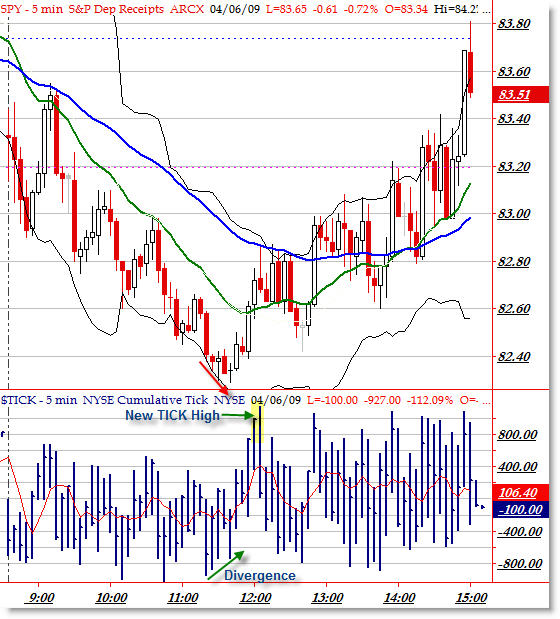
A Focus on April 6th Intraday TICK Divergences
A reader brought to my attention the TICK divergences and new TICK high that gave a clearer picture that the Day’s structure was NOT going to be a Trend Day but that odds favored a Rounded Reversal well in advance of the Cradle Trade. Let’s zoom back inside Monday’s SPY 5-min and go under the hood to see the TICK internals in action.
As price continued lower into the morning session, the TICKs continued to make lower lows and lower highs until 11:30, when a distinct positive TICK divergence came as price creeped to new lows (forming doji reversal candles). A TICK divergence is often far more powerful than a standard momentum (oscillator) divergence because it ties directly into the “market internals” or Breadth (number of stocks on a current up-tick vs those on a down-tick).
I’ve highlighted so many times how intraday highs and lows are formed on Divergences.
Directly following the Positive TICK Divergence, price swung into the 50 EMA for resistance, but look closely at the significant new TICK high (all the way to 1,150) that was a hint that a Reversal was officially in place. This reversal signal was aggressive, and came roughly two hours in advance of the “Cradle Trade” which was the official trend reversal zone.
The TICK could have both warned the Shorts to exit earlier and called the bulls out to play to the long side for an aggressive opportunity to capture a larger piece of the trend reversal. Throughout the rest of the day, the TICK made new highs roughly each time price did, which further confirmed the move and hinted that the best strategy was to buy pullbacks.
That’s why I advocate close inspection of each day’s intraday action – you never know what you’ll learn that will help you in the future!
Corey Rosenbloom
Afraid to Trade.com
Follow Corey on Twitter: http://twitter.com/afraidtotrade
Travel to the LA Trader’s Expo in June to hear Corey speak on “Idealized Trades for Intraday Traders”


Awesome,thanks for sharing.
Hi Corey…. Sorry about this comment not being related to this post, but If you do get some time, could you please do a review of copper. I somewhat see a 3 push reversal pattern developing, would love to know your take on copper. Hope it’s not much of a trouble to you …. Thanks in advance
Cheers
Hi Corey,
The above chart just add another arsenal to increase our probability to trade better.
As I woke up this morning, I watched George Soros interview in Ticker Sense and he mentioned about shorting the Pound at 2 and just covered it. I would appreciated if you can give us an analysis (charting) for that trade for study of the mind of the legendary trader at work.
Brandon
Corey,
Appreciate all the analysis via afraid to trade. Been following for a good while now. Looking to go out to some trading expos soon.
Was wondering where the TICK data is available? (Other than tradestation) I use mainly optionsxpress, trademonster, and good old yahoo.
Thanks,
Andrew
Andrew,
Thank you for reading! The Traders Expos are great.
The best place perhaps to find the TICK for free would be StockCharts.com, symbol $TICK. You can add it as a bottom-pane indicator (price).
I’m guessing any of those – OptionsXpress & TradeMonster – both of which are good programs – should have the TICK data – you just might have to do a search for it.