A Hideous Bull Trap Snaps Gold GLD Traders
If you’re trading Gold or the ETF GLD this week, you probably are suffering a case of whiplash from two traps that triggered this week.
Let’s study these two events and then note the key Daily Chart planning levels to recuperate and get settled for the next move.
Here’s the Hourly Chart which highlights the Bull and Bear Traps this week:

The recent Bull Trap in Gold corresponds well with the Bull Trap in the S&P 500.
Take a moment to review this morning’s post on the S&P 500 Bull Trap and compare notes between these markets (it’s a great educational example if you’re new to what Traps are in the market).
For the intraday chart of Gold (seen here with the @GC Gold Futures Contract), we start with a Bear Trap Failed Breakdown and Reversal on April 24th that gave way to a huge bullish impulse by April 27th.
Price and momentum burst to new highs but on the peek above $1,210, momentum failed to keep pace with price, resulting in a negative divergence.
Note also the slight positive momentum divergence that occurred on the Bear Trap.
Momentum Divergences can be very useful for determining whether a breakout is likely to succeed or fail like these into Trap Outcomes.
We’re most interested in the collapse today from the Trap that occurred Tuesday and Wednesday.
The key Magnet Level (as we’ll see) is the $1,200 per ounce reference level which held as support temporarily ahead of today’s collapse.
Buying pressure evaporated as price fell sharply down away from the $1,200 pivot as sellers became aggressive and buyers took stop-losses (selling to liquidate).
Price broke not only to the mini-support level into $1,185 but all the way to the $1,175 level which was the genesis from the earlier Bear Trap Reversal.
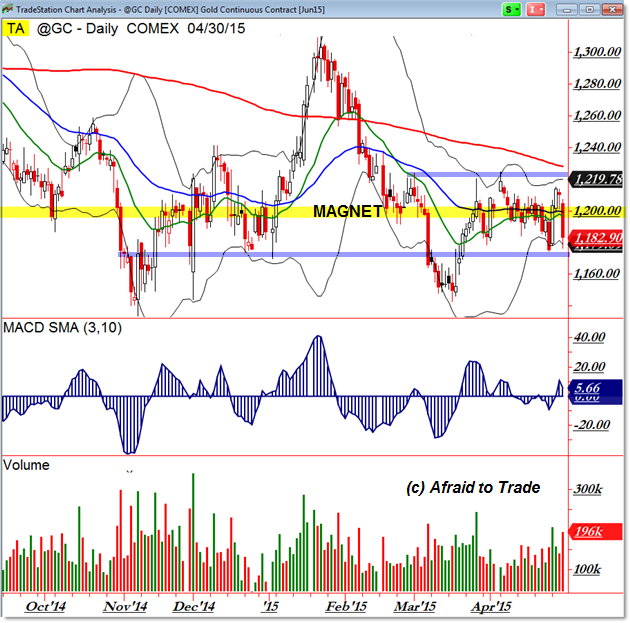
We can see the Magnet Level – and planning pivots – on the Daily Chart:

First, let’s start with the fact that Gold is in a Daily Chart SIDEWAYS Trend (consolidation).
This makes the Midpoint or Value Area at $1,200 which we’ll refer to as our “Magnet Price.”
Thee are shorter-term pivots into $1,220 and $1,180 from which our intraday “Traps” occurred this week.
One of the most powerful trade set-ups is to identify a negative momentum divergence clearly developing on a lower timeframe (such as the 30-min or hourly chart) which is occurring into a key pivot level on a higher timeframe (such as the $1,220 noted above).
The same would be true for a Bullish Divergence on a lower frame developing into a higher frame support pivot.
Nevertheless, these short-term ranges put the intraday “Traps” into perspective.
A breakdown here under $1,180 suggests the two lower price pivots are valid targets near $1,150.
Otherwise, an upside breakthrough beyond $1,220 opens gold to trade higher toward at least $1,250.
Thus we have a short-term consolidation or neutral zone between $1,180 and $1,220 in the context of a slightly larger Daily Chart range as noted.
If you don’t trade Futures Contracts – or are new to trading and prefer to trade ETFs, the picture in GLD is similar:

For the GLD ETF, look for a possible pivot into the support zone near $112.50 and an upper resistance pivot under $118 (or the $117 level).
The Midpoint Value Area for GLD exists at $115 per share.
Yes, this week has been violent but it has occurred between two clear higher timeframe pivot zones.
These – along with the Midpoint as noted – will be your reference zones for Friday and the week ahead.
Follow along with members of the Daily Commentary and Idealized Trades summaries for real-time updates and additional trade planning.
Corey Rosenbloom, CMT
Afraid to Trade.com
Follow Corey on Twitter: http://twitter.com/afraidtotrade
Corey’s book The Complete Trading Course (Wiley Finance) is now available along with the newly released Profiting from the Life Cycle of a Stock Trend presentation (also from Wiley).


One Comment
Comments are closed.