A Key Make or Break Level Here for Russell 2000 and IWM
The Russell 2000 Small Cap Index has shown relative weakness to the S&P 500, but the index – and the IWM ETF – are at key pivot levels traders should know.
Let’s update our chart and note the bull/bear pivot point level for our trading plans:

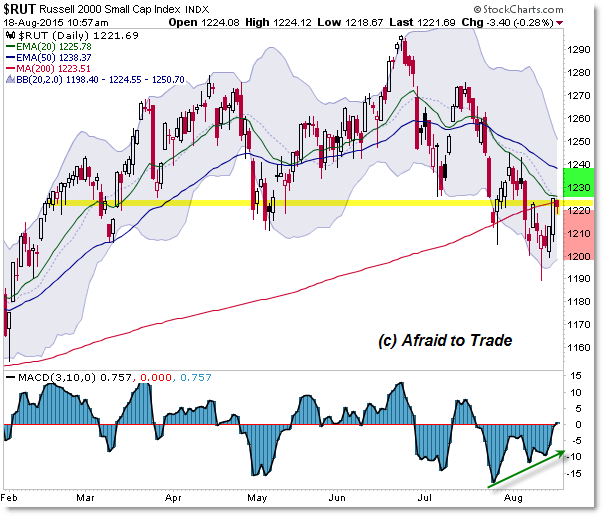
The chart above shows the Russell 2000 Index on the Daily Chart with our key level highlighted.
In simplest terms, the 1,225 level is our key bull/bear pivot zone going forward.
Note the overlap of the falling 20 day EMA with the rising 200 day SMA (moving averages).
This is providing an upper wall of resistance for price; however, this does not mean buyers can’t break through the ceiling.
Thus we’ll reference 1,225 as our key pivot level where we’ll once again trade bearishly “down away from” this level but be prepared to trade a short-squeeze fueled breakout “up above” 1,225 toward 1,230.
Note that a continued breakout higher sets in motion a play toward the 1,240 target as highlighted.
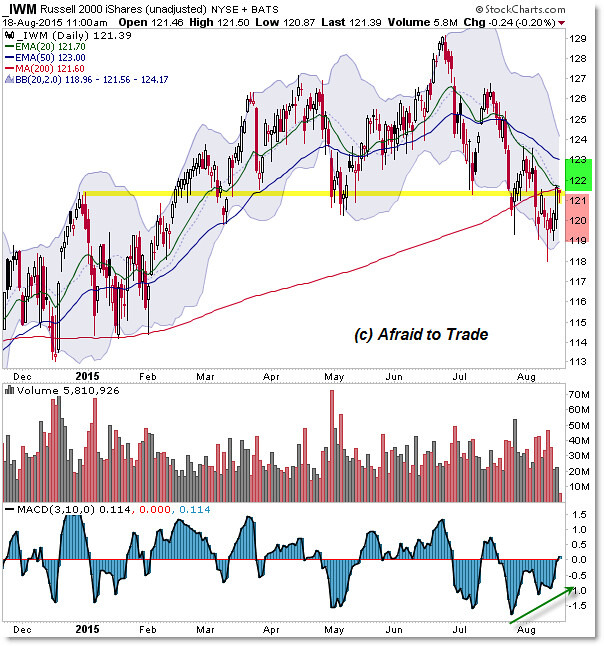
We can see the same levels operating on the popular ETF symbol IWM (Russell 2000):

Similarly, the tradable levels for the IWM ETF are the $121.50 “wall of resistance,” the $123 per share upper target (if above $121.50), and the lower support target into the $119.50 level.
Notice how the $121.50 level has been both resistance and support through 2015.
Be neutral and unbiased with your analysis and look to trade the movement “away from” this level.
Follow along with members of the Afraid to Trade Premium Membership for real-time updates and additional trade planning.
Corey Rosenbloom, CMT
Afraid to Trade.com
Follow Corey on Twitter: http://twitter.com/afraidtotrade
Corey’s book The Complete Trading Course (Wiley Finance) is now available along with the newly released Profiting from the Life Cycle of a Stock Trend presentation (also from Wiley).

