A Lesson on How a Failed Trade Can Forecast an Intraday Reversal
It’s helpful to study the trades of the day to learn important lessons we can apply to future sessions.
We want to know if we made any mistakes and thus need to correct them, or whether the market gave a valid trade signal yet real-time developments overruled the original trade, resulting in a loss.
Sometimes when the market ‘busts’ or invalidates a high probability set-up, particularly after a strong gap, it can have short-term forecasting insights for the remainder of the trading day.
A failed trade can provide the necessary clues to reveal a shift in the supply/demand relationship either that we missed in real-time, or else dramatically shifted during an otherwise valid trade.
Let’s take a look at such a situation from the intraday SP500 action (using the SPY ETF as a proxy yet the lesson is just as applicable to other markets and futures contracts) on May 23, 2013.
Here’s the logic behind the initial retracement trade set-up after a strong downside opening gap:

With a large downside gap, we would be looking for any signs of additional continuation for a possible Trend Day development, which would put our focus on potential retracement or intraday “flag” trades that may develop.
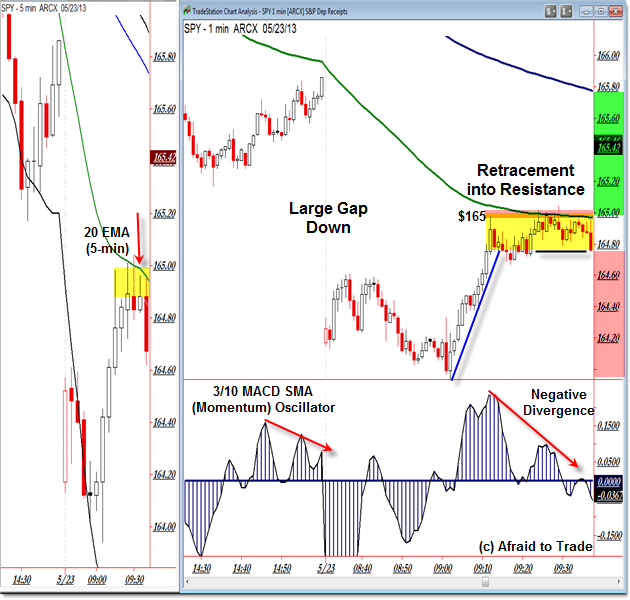
The chart above shows the 5-min chart (left) along with more detail on the 1-min SPY intraday chart.
The main idea of the 5-min chart is that price completed a large downside opening gap and has retraced into a dual confluence area of the falling 20 EMA along with the simple “Round Number” of $165 (roughly 1,650 in the SP500 index).
This alone would be a simple trade set-up via flag or retracement logic, but we also see a corresponding negative momentum divergence in the 3/10 MACD SMA momentum oscillator.
Clean retracement set-ups often develop with a market retraces to a potential resistance or inflection price while the lower timeframe chart reveals a negative divergence (be it in market internals, volume, or momentum).
An aggressive trade entry develops INTO the known resistance area (as close to $165 as possible) while a conservative entry requires a trigger, usually in the form of a breakdown under a rising trendline, 5-minute reversal candle low, or else the break of a horizontal support line (as is the case here into $164.80).
Let’s take a closer look at this set-up in terms of entry, targeting, and of course stop-loss placement:

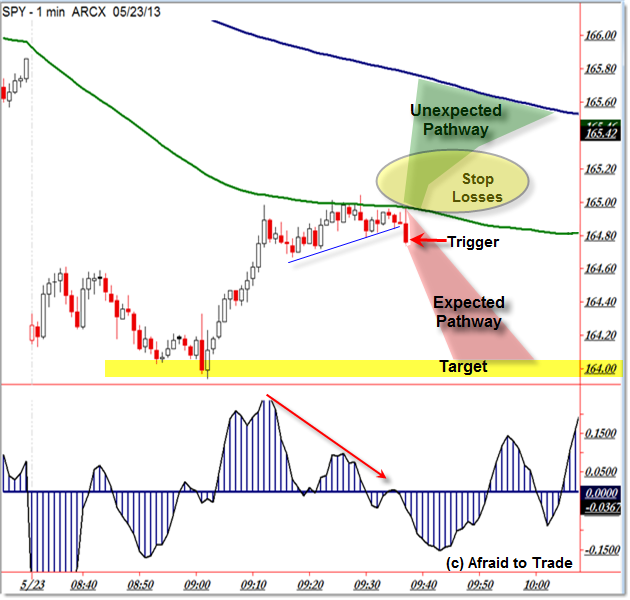
When planning any trade (this is true for Swing Traders, not just intraday traders), it’s helpful to create a pathway for expected price movement along with an alternate pathway that you believe price should not travel (for example, above a resistance level).
The 1-min SPY chart above shows the $165 level and the 20 EMA (from the 5-min chart) which form the basis for the expected resistance area that price “should not cross.”
Traders in general will locate stop-losses at various prices above a known resistance level, though many will locate stops near the same level which results in a cluster or “pocket” of resting stop-loss (buy-to-cover) orders.
Thus, we have a “pocket” of stop-losses above this resistance area and an “unexpected” pathway for price to travel if instead buyers overpower sellers who expect the market to trade lower for the rest of the session (for reasons other than the charts above)
Our expected or likely pathway is highlighted in green which represents a stable, steady movement lower at least toward the session low into $164 (though bears/sellers may hope it trades even lower that that for additional short-selling opportunities under $164).
For this example, we’ll use the following parameters:
- Trade Trigger: Into $165 (aggressive) or under a trendline ($164.80)
- Stop-Loss: Placed depending on risk tolerance above $165 (stops will cluster above this level)
- Initial Target: A sell-off at least toward $164 which is a round number and the session low
The trade has a superior reward to risk relationship (greater than 3:1) and – per our assumptions at least – greater odds of trading down from resistance (with divergences) toward the low as compared with breaking immediately above the ‘cluster’ resistance at $165.
We’ll be on guard for any surprise price events and monitor the movement toward – or away from – our expected target.
The chart below shows two “surprise” events and the eventual outcome of the trade:

While price initially traded lower toward our simple target – moving from $165 to a low of $164.40 – two surprise bullish events occurred which “busted” or broke through the price pathway we created.
Two waves of buying pressure sent price rallying 40 cents each at 9:50 and then 10:05am CST. That wasn’t part of the plan!
Depending on how they managed the trade (closing a profitable position at the first sign of danger or else bravely holding on through surprise developments that do not trigger the established stop-loss), traders who took the same set-up experienced different outcomes.
Those who adapted to the unexpected bullish events may have exited with a small profit while those who did not interpret these signals – or else held the position either until the pre-established stop or target was hit – resulted in a stop-loss from an otherwise high probability-perceived retracement set-up.
Note the sudden upside acceleration as price entered the “Pocket” of stop-losses, which created a short-squeeze event that helped propel prices higher (as short-sellers joined with the buyers to boost prices in a quick impulse of rapid buying pressure).
This itself – the unexpected entry into a “pocket” of stop-losses above a resistance level – is an aggressive trading opportunity for those who are comfortable trading “failure outcomes” or breakout events driven by a ‘squeeze.’
The main idea of this lesson is not so much in trade management tactics, but in the MESSAGE sent by a perceived high-probability or high-confluence (many indicators aligning to suggest a certain outcome) trade set-up failed.
At the core, it often reveals a “stronger than expected” shift in the supply/demand (bear/bull) relationship that either existed prior to our trade (and wasn’t visible perhaps beforehand) or else shifted dramatically DURING a trade that otherwise would have met its objective.
In simplest terms, when a high probability or high confluence intraday trade blatantly fails, it reveals that we should consider adapting to the new supply/demand environment and stop trying to trade in the original direction (in this case, to the downside).
This can prevent us from losing money on future failed trades that go against the new supply/demand balance (or price trend).
As I hinted earlier, a failed trade that results from a sudden shift or (revelation of a shift) can be a sign that the market is “tipping its hand” that the remainder of the session will likely be bullish (in this case).
While sellers had plenty of indicators in their favor, they were unable to overcome the buyers who are stepping in for many reasons other than the charts (or our perceived high-probability trade set-up).
Intraday Trend Reversals can quickly occur when short-term/intraday sellers become buyers (either buying-to-cover suddenly losing positions or flipping over to the bullish side themselves after a failed trade) and join with higher timeframe influences entering a market.
The chart below shows the Bearish Bias (red) in the morning which suddenly shifted to a Bullish (or at a minimum, Neutral) Bias BECAUSE OF the failed high-probability pro-trend (intraday) retracement set-up:

We see the entire session in hindsight but try to visualize it as it unfolded and the collective thoughts of traders as the session progressed.
The breakthrough above $165 – invalidating a retracment set-up and breaking known resistance (thus triggering a quick short squeeze) – immediately shifted the bias from the bearish-favored to the bullish-favored, so long as price remained above this barrier level.
It led to additional breakout and retracement trades as seen above as potential future (at least from the 10:15am CST breakout) opportunities.
At a minimum, we should be open to the message of price (the market) when it reveals an otherwise valid set-up or trade logic has officially failed.
It suggests that the supply/demand relationship (imbalance) that resulted from the failed trade may continue throughout the remainder of the session, and we thus need to adapt as additional real-time information from price develops.
Corey Rosenbloom, CMT
Afraid to Trade.com
Follow Corey on Twitter: http://twitter.com/afraidtotrade
Corey’s new book The Complete Trading Course (Wiley Finance) is now available along with the newly released Profiting from the Life Cycle of a Stock Trend presentation (also from Wiley).

Corey
This is a beautiful lesson; well-constructed, well-articulated, easy to see visually, and full of relevant market insight. I follow you on twitter, and I only get tweets from two other traders. Well done! Thank you.
David
Failed signals are often stronger than the original one, very true. In my experience, when a strong Candlestick Reversal Pattern with big volume, it can lead to an even bigger move in the opposite direction. Great post.
There were conflicting signals on the 5-min chart and its higher timeframe 30-min chart. While 5-min set up for a valid retracement short, 30-min presented a low-risk long opportunity into a dual confluence zone of the 200 SMA and the $164 “psychological” support level. So it might not be a failed setup but rather a weak setup from the perspective of a higher timeframe.
Hi David,
Excellent point and I debated addressing that in the post (but decided it was too long already).
Precisely – with an hourly or even 30 min chart, there were visual higher timeframe EMA (and Fibonacci) Confluence into the known 'round number' $164 level which resulted in buying pressure from higher timeframe traders watching that buy signal. It did conflict with the short-term (5-min) flag/sell signal and as we see the buyers overpowered the sellers, resulting in the 'failed' 5-min classic flag signal.
It's not a failed set-up from the 30-min chart but for 5-min or 1-min traders who didn't see the HTF structure – and that's perfectly fine (we can't see it all in real-time) – it did result in a failed valid trade. The lesson is the same – a failed lower frame trade means the supply/demand relationship is stronger than the chart is showing and it may very well be due to a higher frame reason (or fundamental reason beyond the charts).
Matt,
You got it! One of my favorite trading sayings is “IF something should happen but does not, THEN it often leads to a larger than expected move in the opposite direction.”
I think through experience, we all develop our own phrasing of this important concept. Thank you for sharing!
Hi! I am creating trading system. I am getting intraday record for my stock every second. I have formula to compute ema from last ema value if exists else use SMA value. Ema 10, ema 20… number 10, 20 define value for multiplier.
1) How can i compute ema10 on 1min and 5min time frame? When i compute ema10 1 min i will compuute new ema every 1 min from value 1min before…and in 5min ema every 5 minutes from value before 5min?
2) when starting to compute 5 minute ema 10 i need compute simple moving average SMA from first 10values and use it asfirst ema input. From this i think: i will get first ema after 10 x 5 minutes? I am creating short term trader and i thing this is too long init time for ema10 5min. Is this correct process?
Thanks for helping me