A Little Elliott Wave on 1 Minute Chart into the SPY Close
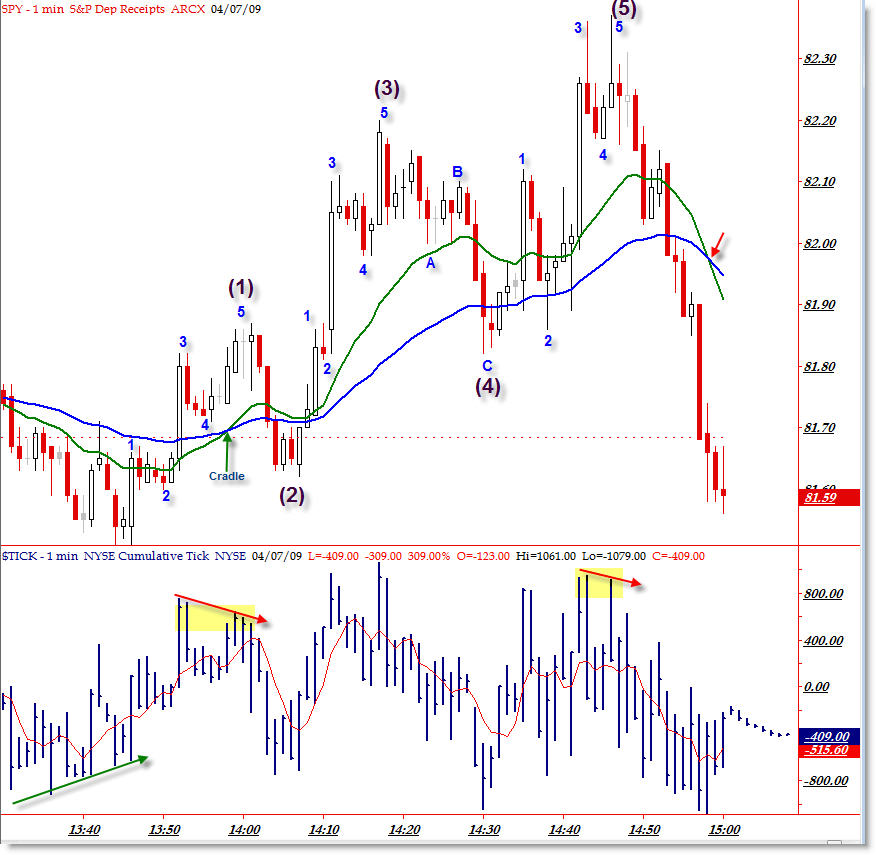
I wanted to show you an interesting Elliott Wave fractal that set-up into the close of the trading day for April 7th on the 1-minute chart – mainly to show the fractal nature of the Elliott Wave Principle.
(Click for larger image)
I’m also still keeping the TICK on the chart from last night’s post that focused on TICK Divergences.
Notice the Five-Wave structure that began off the 2:30 (EST) lows that continued until the final swift downswing into the close. It’s not as interesting to just point out a five-wave structure, but look very closely at the sub-division of that structure: Each sub-wave conforms to the Elliott Wave principle to highlight the fractal nature of expected Wave progression.
Waves 1, 3, and 5 all subdivide as expected into their own Five-Wave structures (with Waves 2 and 4 being a three-wave counter-move).
Remember the logic behind the waves themselves and why the ‘five wave’ structure is applicable across all timeframes:
Wave 1 is the “Doubt” Wave where people believe it to be still a false rally in the context of a down market
Wave 2 is the “I told you so” Wave where people expect a new low to be made, but it does not occur
Wave 3 is the “Realization” Wave where shorts cover and longs buy in while opinion shifts bullishly – that’s why 3rd waves are often so powerful
Wave 4 is the “Surprising Disappointment” Wave where people take profits, and traders are often looking for a support level to ‘buy into the dip’
Wave 5 is the “Euphoric” Wave where people get greedy and demand is exhausted as aggressive shorts step up – newer traders often ‘buy at the top’
As an aside, positive divergences often form going into Wave 1 and negative divergences often form going into Wave 5.
I though you might find this structure interesting, given that it occurred on such a small timeframe! As always, the more times you see these patterns, the better you’ll be in real time to recognize them and take advantage of the opportunities that present themselves.
Corey Rosenbloom
Afraid to Trade.com
Follow Corey on Twitter: http://twitter.com/afraidtotrade
Travel to the LA Trader’s Expo in June to hear Corey speak on “Idealized Trades for Intraday Traders”
Unless I’m mistaken, the Elliott Wave rules don’t allow Wave (4) to overlap Wave (1), as it does on your chart.
I almost made a note of that on the chart but decided against it for simplicity/clarity.
This is now the second post about a 1 minute Elliott Wave Cycle and both posts clearly violate one of the “Three Hard Rules”. I am an avid Elliottician as well, but surely you can find an example on a 1-minute that does not violate rules. My only question is, which rules are okay to bend or to break and when is it okay to do so? I agree this is a near-perfect example but it still violates “hard rules”. I can find you plenty of examples of a legitimate full wave cycle on a 1 minute ES during the day. Look closer.
http://blog.afraidtotrade.com/one-minute-elliott-wave-example-on-todays-dia/