A Look Back at US Steel
US Steel (X) was a grand beneficiary of higher commodity prices in general, but just as its share price ran up in the commodity bubble that ended in 2008, price fell to levels few thought possible. Let’s take a look at the monthly chart – containing a near ideal Elliott Wave pattern – and more recently on the daily chart.
US Steel (X) Monthly:
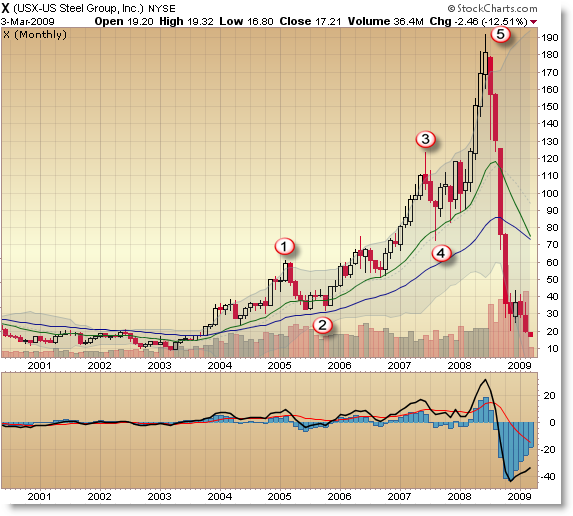
Price began an initial move up off the 2003 lows which took price up 600% from $10 to $60 in a Wave 1 advance that gave way to a 50% correction into EMA support in 2005. The powerful 3rd Wave advance began that took price from its $30 price up $100 to $130 before falling back into a second large (Wave 4) correction back down into support via the rising 20 month EMA.
Price retested this rising average three more times (giving good, simple buy/entry signals) as price climbed $100 again – this time from $90 to $190 before price peaked in a final 5th Wave advance as commodities peaked in mid-2008. Since then, price has fallen an astounding 90% in almost a year’s time – astounding for such a steady company.
While eyes of investors have focused on the wealth destruction in the Financial sector, they may have missed a similar destruction of investor capital that has taken place in many stocks tied closely to commodities.
Let’s drop to the daily chart to see the structure.
US Steel (X) Daily:
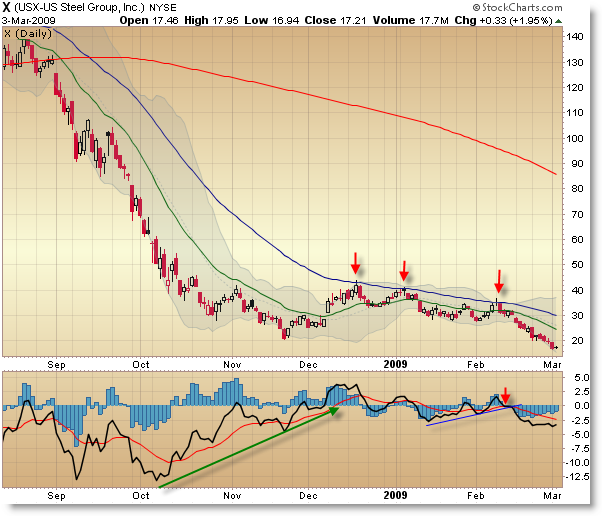
Price fell in almost a steady waterfall decline after breaking the 200 period moving average – also known as the “Line in the Sand” – in September. Generally, the 200 SMA is the last line of defense for buyers.
After falling 50% from $140 to $70 in just over a month, price began to form a positive momentum divergence, but this is a lesson that because we see a divergence does not mean we should be an aggressive buyer.
Price retraced back to the falling 50 EMA three times into the New Year, all of which set-up excellent short-sale trades… or long-liquidation zones for those who were trying to play counter-trend rallies.
Dojis – which often precede short-term price reversals – formed at each test of the 50 EMA.
The momentum oscillator recently broke a trendline in mid-February and price has fallen to a new low not seen since the beginning of its move up in 2003.
Studying the price action in US Steel (X) shows us that it doesn’t benefit us to seek to buy bottoms, and that even solid, strong companies can suffer greatly (beyond what most people can imagine) in a down-market.
Corey Rosenbloom
Afraid to Trade.com