A MidWeek Look at Gold Daily Chart
Gold prices have been confounding both longs and shorts, particularly in a climate of economic uncertainty. Let’s take a look at gold’s daily chart and see a basic technical analysis 101 pattern that’s currently containing the price structure in gold.
Gold Daily Chart:
(Click for large image)
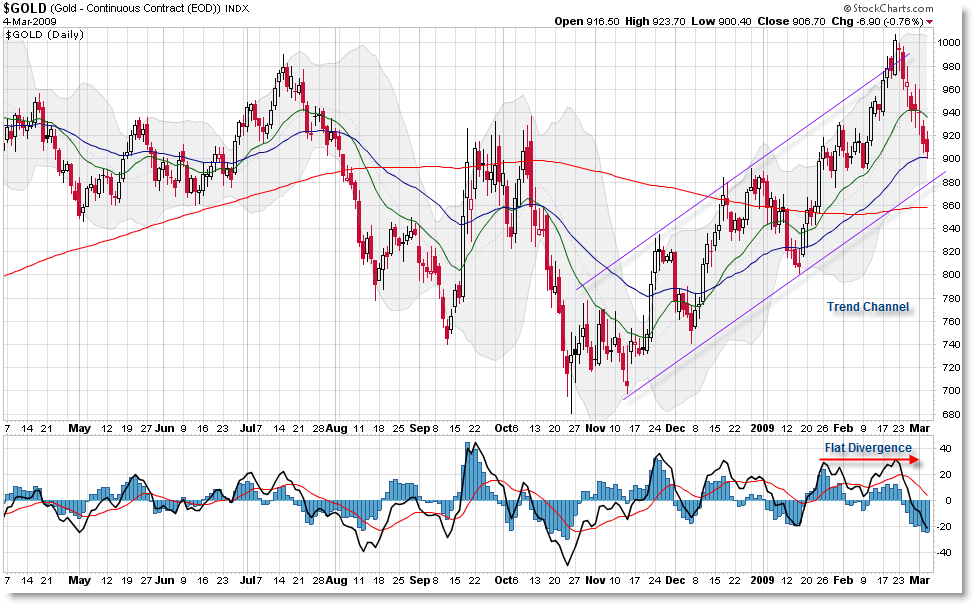
Despite all the Elliott Wave, Fibonacci, Cycle, Indicator, and other chart work done on gold, we see gold prices have been contained nicely – so far – in an upward rising trend channel since November 2008.
It seemed all but certain that at least a pullback was due when prices challenged the $1,000 per ounce level, which is exactly what we got. Notice the flat-line divergence that set-up as price challenged the $1,000 level.Price has now retraced and is challenging support at the rising 50 day EMA… and if the 50 fails at $900 (which also serves as round-number support), then gold prices should be expected to find support at the rising purple trendline around $880. If gold cannot find support at $880, then odds would shift to favor a retest of the $720 level.
For the time being, odds seem to favor higher prices yet to come, as a new momentum high on the weekly chart has formed and gold is currently in a confirmed uptrend on the daily chart. Holding above $880 is key to any bullish argument in gold.
For now, keep focused on these prices and let’s watch as the structure continues to develop.
Corey Rosenbloom
Afraid to Trade.com
Follow Corey on Twitter: http://twitter.com/afraidtotrade
Register (free) for the Afraid to Trade.com Blog to stay updated
hey corey, didn’t see you mention the volume here…is that telling you anything?
I noticed the same things and had the same trend channel drawn.
I sold my DZZ yesterday when GLD got down to it’s daily 50ema, it’s gone down pretty fast and I figured it was due for a bounce soon.
Jeffrey,
Good question – and yes it is. The GLD volume trend has fallen as price has fallen, which serves as a non-confirmation of lower prices and is quite bullish.
In other words, as price has fallen, so has volume, which seems to indicate either normal profit taking is occurring, or sellers are not being aggressive, anticipating higher prices.
Dave,
Good call. We’re having a healthy bounce as I figured we might off the 50 EMA. Initial target – 20 EMA – is already achieved (for a scalp) and we’ll head higher if we can break above EMA resistance at the 20.
Thanks Corey. I made some dough today on GLD based on this chart and your explanation of it.
RK,
I’m so glad to hear that! That’s why I do these posts – to try to be a benefit to readers as best I can, be it educationally or pointing out possible opportunities for additional consideration.
Corey,
I have noticed a head a shoulders pattern forming between late feb (left shoulder) and now the right shoulder has just formed. With declining volumes, this surely a confirmation of the pattern?
Corey,
Thank you for your blog. You provide a great service.
I’m a long time watcher – first time commenter.
I interpret today’s action — a violation of the head and shoulders pattern — as very bullish. Do you agree?
Win
Colin,
Hmm. I’ll have to look more closely at the pattern.
It’s certainly not your textbook H&S pattern but that doesn’t mean it isn’t right. A break of the neckline (at $88 on GLD) would confirm it but it hasn’t happened yet.
We’ll keep watching – good call.
Win,
Glad to have you as a reader and a commenter!
Today’s action (price rejection and support on $88) is bullish, but you have to admit it’s strange that gold is following the market like it is. The traditional interpretation – particularly in times of uncertainty – is that people flee into gold when the market falls and come out of gold and into the market when the market is rising (like now).
Something to keep an eye on.
But you’re right – the $88 level (GLD) is critical for any bullish strength.
Corey,
I’ve been watching gold very closely, and for a while, it was very close to the inverse of the market. Today’s strength in the face of rising equities — or rather, along with equities, though, broke that trend — shattered it. And today’s strength came with rising volume. In fact, I think I see an inverse H and S pattern on the 15 and 30 minute charts.
C,
I’ve been watching gold very closely, and for a while, it was very close to the inverse of the market. Today’s strength in the face of rising equities — or rather, along with equities, though, broke that trend — shattered it. And today’s strength came with rising volume. In fact, I think I see an inverse H and S pattern on the 15 and 30 minute charts.
– Last comment also from Win
Where gold stocks are going in a short term,1) this week, 2)next week, and 3)a week after
for example stocks, ego, gg, gld, aem, abx, au, etc………
what the profesional think
Where gold stocks are going in a short term,1) this week, 2)next week, and 3)a week after
for example stocks, ego, gg, gld, aem, abx, au, etc………
what the profesional think
Gold prices are getting higher and higher as long as the economy slumps.