A Perfect Pullback Lesson from Amazon AMZN
Amazon.com (AMZN) offers us a great lesson – and current opportunity – to study “Perfect Pullbacks” and future trade planning.
Let’s pinpoint the pullback and study the pattern so we can apply it to a similar set-up in the future.
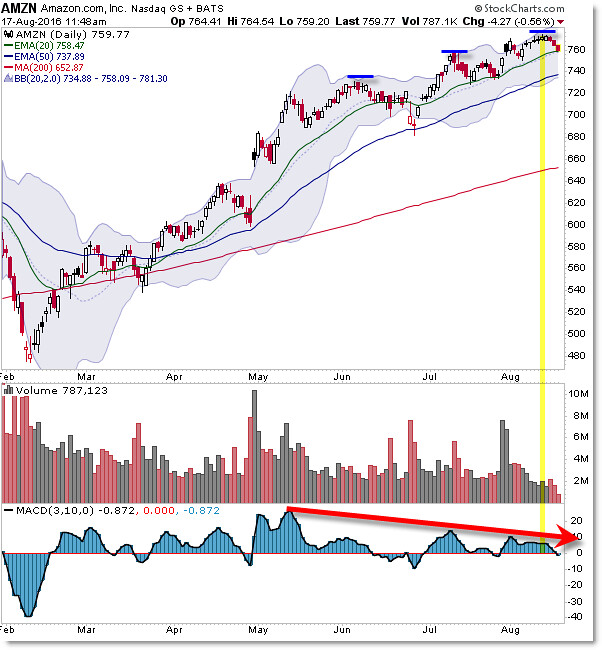
Here’s the Daily Chart:

For a specific strategy, explanation, and in-depth information on “Perfect Pullback” trade planning, check out our “Perfect Pullback Lesson Bundle” for your convenience.
- Amazon.com gives us a real-world example of the lessons we teach in the series, starting with the following:
- A lengthy uptrend
- A Multi-Swing Negative Momentum AND Volume Divergence
- Reversal Candles at the Upper Bollinger Band
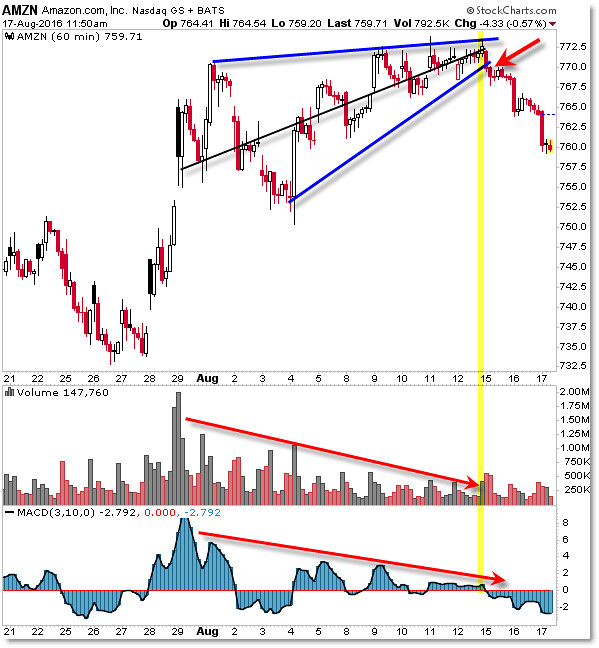
- A Lower Timeframe Confirming Reversal Pattern
No, you don’t need the stars to align like this for a perfect pullback but when they do, you’d want to be aggressive with your trade and press your edge with the odds strongly in your favor.
I’m highlighting the three recent pullbacks (June, July, and now August) from a similar situation.
Stocks in an uptrend have stronger odds of continuing than of reversing, but along the uptrend we see “retracements” or pullbacks, usually to the rising 20 or 50 day EMA.
We get two short-term trading opportunities from these patterns:
The first is the BUY THE RETRACEMENT to the rising 20 or 50 day EMA (pro-trend strategy)
The second aggressive move is to SHORT-THE PULLBACK away from the Bollinger toward the EMAs.
Note how the simple strategy would have fared from May to present.
Speaking of the Reversal Pattern, once you have an expectation on the Higher Frame, you can drop to the Lower Frame for clarity and to see things by stepping “inside” the price action:

Generally speaking this “Bearish Rising Wedge” pattern – also with visual negative momentum and volume divergences – is a stand-alone bearish short-term trading opportunity.
However, when you combine a visual (clearer) negative divergence with a Reversal Pattern on an intraday chart with a similar bearish (short-term) expectation on the Daily Chart, then you get very high odds of a successful (correct/profitable) outcome.
At this point the target is achieved into the rising 20 day EMA (our target) and we’ll focus on the departure away from this pivot.
A bounce up continues the trend while a breakdown beneath the current $760 target suggests a further decline (steeper retracement) toward $740.
Either way, Amazon gives us a great lesson from our specific “Perfect Pullback” Simple Trading Strategy.
Follow along with members of the Afraid to Trade Premium Membership for real-time updates and additional trade planning.
Corey Rosenbloom, CMT
Follow Corey on Twitter: http://twitter.com/afraidtotrade
Corey’s book The Complete Trading Course (Wiley Finance) is now available along with the newly released Profiting from the Life Cycle of a Stock Trend presentation (also from Wiley).


These lessons are not just to learn, but to understand and been able to execute correctly, I am quite lucky to be with OctaFX broker where they have outstanding facilities and features which counts tidy spreads from 0.1 pips, zero balance protection, swap free account plus much more, it’s all present here and is something what helps me with trading and is strong reason why I am so much successful with things which makes me relaxed as well with things.