A Weekly and Daily Look at Fresh Highs in Silver
With all the attention on Gold’s recent breakout, I haven’t seen as much attention focused on the index breakout to fresh 2009 highs in silver! Let’s take a quick look at something interesting in Silver’s (index) weekly chart, as well as the daily structure.
Silver Weekly:

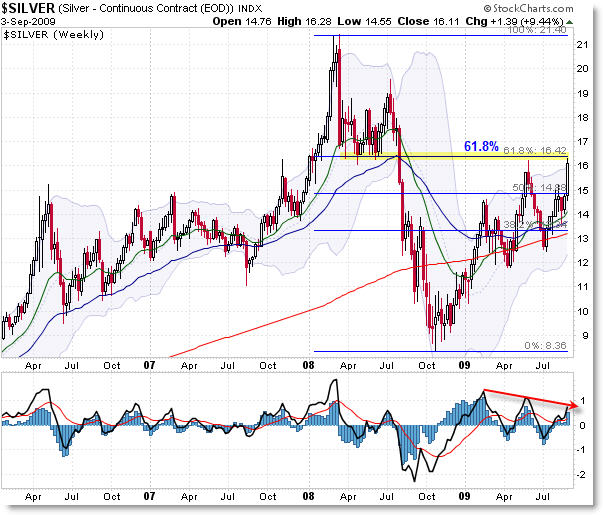
As we’ll see on the daily chart, the Silver Index here broke to a marginal new 2009 high. However, we see a significant potential overhead resistance zone coming in from prior price support in 2008 as well as the 61.8% Fibonacci price retracement level at $16.42 of the 2008 highs to the 2008 lows.
Silver is also slightly above the upper Bollinger Band on the weekly frame. I’d prefer price to close above these levels before becoming ultra-bullish on silver here.
It’s possible we’re in the midst of forming a “Three Push” pattern, complete with triple-swing negative momentum divergence, which would be locked in place should price make any sort of down move from this level.
Let’s drop quickly to the daily frame for a closer view of 2009 so far.

We see price formed a “Measured Move” or “Bull Flag” from the February highs to the April lows – the green arrow highlights the price break and buy signal trigger long.
Silver’s daily triangle price pattern has not been as pronounced as gold’s, but price certainly broke the upper trendline this week in a very impulsive move that took price to a new high by 5 cents in the index.
The momentum oscillator is reading the same level as it did on the prior test of the $16.20 level.
If bears are going to make a stand, it’s here at the weekly resistance areas, and without that, there will be little that remains (chart-wise) to contain a bullish breakout in both silver and gold (note gold has overhead resistance at the $1,000 index level).
Let’s keep our perspectives wide to see what happens from here!
Corey Rosenbloom, CMT
Afraid to Trade.com
Follow Corey on Twitter: http://twitter.com/afraidtotrade
