A Weekly Look at the XLF Financials with Elliott Wave
With a very volatile week behind us, let’s step back and take a look at the XLF Financial Sector from its 2007 peak to present.
XLF Financial SPDR:

The XLF actually topped in May 2007, five months ahead of the October 2007 stock market top which underscores the assumption that Financials lead the broader market. If they continue to lead, then we’re not in a positive scenario for equities.
Price broke the November lows last week to carve in a fresh low at $8.00 per share (a level 77% off its highs), which by no means is bullish. The one slight optimistic picture is that we painted a hammer or dragonfly doji candle at these lows, though that by no means is a good enough reason to buy.
We see price as beneath all three key moving averages on the weekly chart, and they are in the most bearish orientation possible, though we are extended roughly $6 beneath the falling 20 week EMA which one would think would signify ‘oversold’ conditions but look at the 3/10 Oscillator – it is indicating that we’re not quite oversold and that we would have a bit more to travel down before we registered a new low. Anything else would result in a positive divergence, which might actually be what happens.
Notice that the oscillator made a new momentum low in November, signaling lower prices were yet to come – they came this week.
A few readers have asked me to do an Elliott Wave count on the XLF and here is one interpretation – albeit a bearish one – on the XLF. You’ll need to click on the chart for a larger image.
XLF Possible Elliott Wave Count:
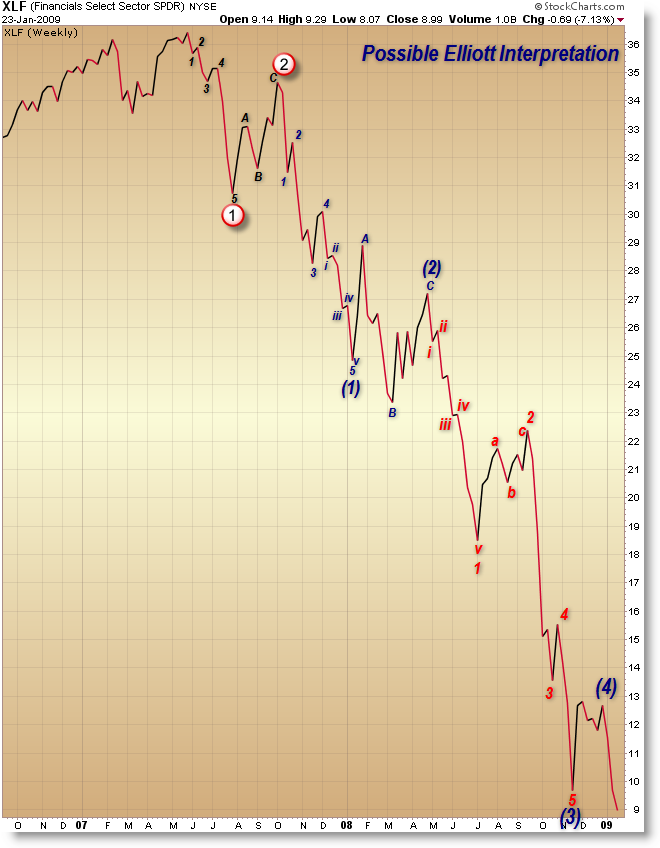
What I’m showing is the more bearish of the two possibilities, similar to that on the S&P 500. I’m showing us as having completed a fourth wave up within a larger (circled) Wave 3 down and that we are currently in fractal 5th of larger scale Third Wave down which is likely about to complete. The only two labels missing from this count at the end (right) would be the (5) and then circled 3 when this downswing is complete.
The good news with this count is that when this downswing completes, we would have put in the end of the hideous 3rd Wave down and would be entering a Fourth Wave (circled) up, which could take us anywhere from $13.00 to $16.00 before resolving back down to new potential lows mid-2009.
I call this the most bearish count because it implies that a final low will take place much lower, as the final 5th wave would terminate at a lower price that the alternate count.
The good news for BOTH scenarios is that we should expect Wave 5 to have equality with Wave 1, which was about $5.00 ($36.00 – $31.00). Because Wave 3 was a (massively) extended wave, expect Wave 5 to equal that of Wave 1 (or perhaps – most bullishly – truncate at the bottom of the major Wave 3 (circled).
The alternate – which I deem “bullish” – count is the following:
Where I have (3) at the November lows, it would actually be Circled 3 (major 3) meaning that the 3rd wave terminated at the November lows and that we now have completed a Circled (major) 4 corrective wave and that – if that’s the case – then we’re already in Circled (major) 5, meaning the ‘bottom’ would be closer (perhaps just a few more swings away) and would terminate at a higher price than the count I’ve shown.
The good news for BOTH scenarios is that we should expect Wave 5 to have equality with Wave 1, which was about $5.00 ($36.00 – $31.00). Because Wave 3 was a (massively) extended wave, expect Wave 5 to equal that of Wave 1 (or perhaps – most bullishly – truncate at the bottom of the major Wave 3 (circled).
If it seems confusing, don’t worry – Elliott Wave is not the holy grail, but it’s like any other indicator which is open to interpretation. Use it to manage risk and open your mind to possibilities and give you structure, but don’t follow it blindly.
Keep watching the XLF and key financial stocks closely, as we would expect to see strength here (which we’re not) before believing the market could recover or – dare I say – bottom.
Corey Rosenbloom
Afraid to Trade.com
That’s one bearish count. Scary for all of us. Thanks for the pro-bono work!
Corey,
Elliot waves are way above my knowledge, I appreciate your posts though.
One obs. consistent with XLF in the last 4 months is http://stockcharts.com/h-sc/ui?s=xlf&p=D&b=5&g=0&id=p12889936023
Look at the RSI, everytime the RSI hit @ 50 in the last 4 months, XLF went down lower. While anything may happen in the market, that may serve as a short term guide. same with JPM as well. http://stockcharts.com/h-sc/ui?s=jpm&p=D&b=5&g=0&id=p12889936023
insane,
And I don’t consider myself bearish! I’m just trying to be objective and gather the facts which is why I’m presenting two possibilities. Unfortunately, the way I’m interpreting it says we’re not done yet. I base it on the “third of a third” principle where the largest thrust is the ‘third wave of a larger third wave’ which is how I let the count guide me.
In this case, I labeled the major ‘thrust’ in October as the iii of a (3) of a 3, which seems the most logical classification to me, placing that strong wave in the ‘heart’ of the decline.
Anon,
Nice charts. The 50 area has served as Bear Market resistance clearly, as the recent development showed.
Also, we pierced 20 on the RSI with the recent downswing and as I suspected, it triggered an oversold condition. Not guaranteeing a rally, but at least suggesting the possibility.
Any chart that goes from 8 to 36 needs to be viewed on a semi-log scale to properly evaluate the proportionality of its constituent Elliott waves.
Andrew,
Especially since I used a portrait landscape which stretched the vertical. I’m so used to the standard charts and don’t do much work with log charts. I’m more concerned with price dollar moves than percentage moves so I’ve gotten so used to that. I just don’t like how log charts compress the upper data and over-emphasize the smaller price data. I’ll just have to get used to it.
Thanks for the xlf post,I really appreciate it.Im by no means an ewt expert,but i know a smart Wachovia Sec money manager who is and he said this is a classic 5 wave down pattern.Add this with the hammer doji,Jamie Diamon buying 11 million dollars of jpm stock on thursday,and the heavy call volume yesterday,you know what they if smells like a rat then you know the rest.
Anybody read the Barron’s article on “buy oil?” I think the better play is to watch gasoline to see if it completes the inverse H&S – http://chartsandcoffee.blogspot.com/2009/01/uga-waiting-for-breakout-on-gasoline.html
Also, AVAV as a potential long candidate – http://chartsandcoffee.blogspot.com/2009/01/avav-aerovironment-inc.html
Corey, banks will become functional again and start lending to businesses and consumers with use of financial engineering implemented by government (good/bad bank or such). But I think that common stocks of financials will lag greatly due to subordinated position after government, bond, and preferred stock holders take almost full control of equity. Market will realize this and start enormous rally without the financials. New leaders will emerge and take the S&P index higher.
Nnecker,
There’s a valid debate that we’re in the terminal Wave 5. Perhaps it’s showing thst structure.
I chose this count because it better displayed my interpretation of a third of a third (or in this case, a third of a third of a third) as the preferred count.
Paul,
It will take bank stability and willingness to lend to jump-start the economy. Many argue banks aren’t quite there yet.
It will be interesting to see how bank stocks perform particularly with partial government control if it comes to that.
The September to November decline was clearly the steepest and had the strongest momentum readings so the count as presented is the clear favorite. One thing to keep in mind; the most common relationship when the third wave is the longest is for the first and fifth to be equal and that may mean the bottom is not quite as far away as it would seem from looking at wave three. The index is already in single digits, zero is the limit. Sorry Corey but this is just the case where log scaling becomes very useful.
Andrew,
I mentioned the possibility of Equality with Wave 1 particularly with such an extended 3rd wave. In fact, it would not be surprising perhaps to see a truncation.
I had a discussion this weekend with someone who had a valid point that the lows might already be in, particularly if the 5th wave truncates (under either scenario). I’m not willing to go that far, but the possibility does exist.
I’ll try to present log charts from now on with such large price moves.
We now have an even larger positive momentum divergence on the daily chart – new price lows were made in November and January but the momentum osc has made higher lows on each of those new prices lows.
Dave,
Spot on – we have a triple swing, positive momentum divergence on the daily, which would likely support that we are about to embark on a larger than normal counter-swing up (large Wave 4) or perhaps even make a bottom (we have to explore that possibility). Let’s see if we can break those daily moving averages next.
Yes, it does appear that we’re due for another attempt at the 20 week ema resistance. Even on the daily timeframe we’re pretty far extended below the 20ema. A trip back up to the daily 20ema would be a 20% gain from current levels, to the weekly 20 would be 50%. But as you said, there’s no really no reason to buy at this point.
When I started trading last spring I would salivate over potential gains like I mentioned above and often play knife-catcher on trades like this, more often than not coming out a loser. I’ve definitely learned to have patience in waiting for the right opportunity.
DaveB, you are absoultely right. Patience is a great virtue.
In hindsight, my short at S&P 1411, and held with patience, would have made more 10 times more money than what I could scrounge with all my hard work of trading since spring of 2008. It pays to be lazy!
Moreover, even though all my trades since last spring have been shorts, I had severe drawdowns, maybe because I did not use stops, during brief periods of ferocious rallies. If only I had ignored those rallies, I would have still done pretty good.
The only problem is that we never know what will happen next!
This might be a real fact that we must face all of these things but all i can say is that we must expect the things that are unexpected.I hope your blogs will generate more feedback because you take the time to write them so we should take the time to respond.