Amazon AMZN Bullish Surge from Big Divergence on Support
Amazon’s (AMZN) solidly earnings beat expectations yesterday, resulting in a breakout and stock surge higher.
However, a bullish reversal pattern – coming off a critical support level – preceded this breakout and gives us a great chance once again to study this important reversal pattern.
Let’s chart the pattern and then identify current price levels to watch for triggers and targets.

Building on last night’s “Lessons in Divergences and Reversals” post (reference it for background), Amazon (AMZN) gives us another real-time example of this important pattern and swing trading tactic.
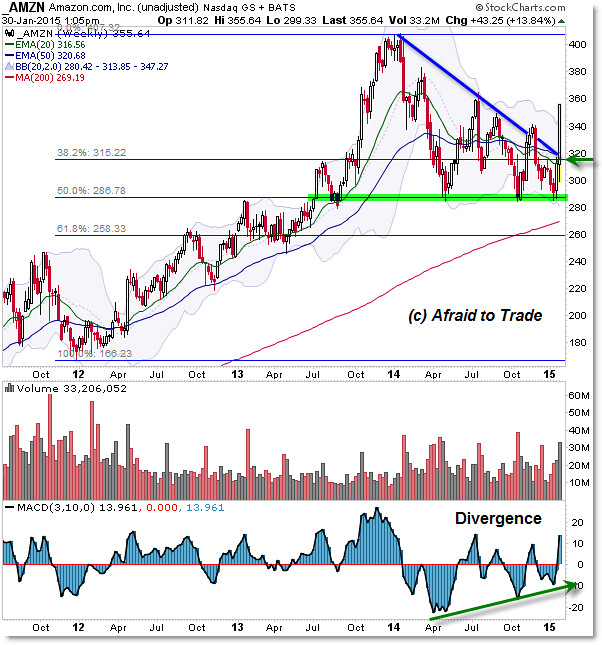
I’ve highlighted the 50% Fibonacci Retracement in prior updates, but use it as the current reference pivot.
The level is roughly the $287.00 level (green highlight) as shown in the chart above.
Notice the three support bounces that developed off this level in 2014.
With the recent earnings announcement, price surged through the $320 level and broke the falling trendline.
Price then reversed the sell-swing (off support from positive divergences) and now trades through “Open Air.”
Let’s zoom in to the Daily Chart to highlight key levels to watch for current targets:

The Daily Chart highlights the Downtrend and lengthy positive divergence that undercut price at the $290 support level mentioned in the weekly chart.
Buyers found value and stepped in to buy Amazon collectively at these levels (May, October, and now this January).
Price already shattered the falling 200 day SMA and then the prior swing high into $340 per share.
Beyond that, the earnings gap took price above the next prior swing high into $350 per share.
At this point, price appears to be targeting the July swing high (ahead of an earnings down-gap) just above $360 per share.
We’re simply using prior swing highs as upside targets – it’s easy but effective for planning targets.
A breakthrough of these levels allows an aggressive breakout (bullish) trade, though more conservative traders may prefer to wait to enter on a retracement that develops on a move down from these target (possible resistance) levels.
Continue monitoring the current up-swing in price and the target levels above.
Follow along with members of the Daily Commentary and Idealized Trades summaries for real-time updates and additional trade planning.
Corey Rosenbloom, CMT
Afraid to Trade.com
Follow Corey on Twitter: http://twitter.com/afraidtotrade
Corey’s book The Complete Trading Course (Wiley Finance) is now available along with the newly released Profiting from the Life Cycle of a Stock Trend presentation (also from Wiley).


Awesome post.
I like trading with keeping all these key levels in mind
since these are the stuff that can be the difference marker in making us
succeed or fail while we also need to make sure we go with the trend not
against it. I really like and want to appreciate the work ATT (this blog) does
since it is very useful for new comers. I always love analysis since that’s
what I also follow from my broker OctaFX and it’s really powerful to gain me
consistent profits.