Apple AAPL Price by Volume Level Charting into November
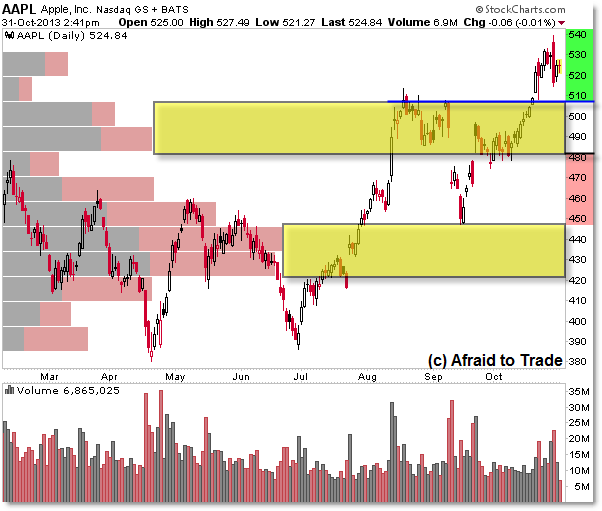
Let’s take a quick look at a “Volume at Price” Chart of Apple (AAPL) to study the breakout and prior high-volume value areas which may come into play as we begin November.

This is a special way to combine Price with Volume to highlight areas of “Value” or price acceptance.
Starting with the highlighted regions, the two yellow highlighted squares reflect price ranges with high volume traded within the range.
As usual, gray volume reflects “buy” volume which is overlaid with red lines of “sell” volume.
You can also compare the traditional volume indicator on the lower panel of the chart.
Essentially the chart displays volume transacted at key price levels which enhances the horizontal trendlines or rectangle price patterns you can draw on the chart.
What does the new chart tell us?
First, the “highest price/volume node” is the $420 to $445 region which represents the lengthy trading range from earlier in 2013.
Second and more importantly, the closer $480 to $510 price/volume region tells us the boundaries of the recent consolidation and “value” region on the price chart.
The recent breakout above $510 was indeed met with higher relative volume, but note that the two largest “spikes” were actually during down or ‘sell’ days.
The recent activity also tells us that more price/volume activity is trading between $520 to $530 per share, which gives a short-term reference.
By the same logic, price tends to move quickly through areas of low price/volume regions which I like to call “Open Air Pockets.”
While we can see “Open Air Pockets” simply with price, the Volume at Price chart gives a deeper perspective of trader activity.
Simply stated, a breakdown under the $520 support would enter a short-term ‘pocket’ toward $510, and a re-entry within the larger Value Area between $480 and $510 would suggest that price would be ‘pulled’ back within at least the midpoint of this rectangle range near $490 per share (if not the $480 trendline low).
However, a breakthrough above $540 would continue the pro-trend or breakout event in motion toward higher timeframe targets shown in our prior Apple (AAPL) update.
Incorporate the higher frame targets and value areas with the shorter-term ‘pockets’ and key levels seen on the special “Volume at Price” chart.
Join fellow members to receive daily commentary and detailed analysis each evening by joining our membership services for daily or weekly commentary, education (free education section), and timely analysis.
Corey Rosenbloom, CMT
Afraid to Trade.com
Follow Corey on Twitter: http://twitter.com/afraidtotrade
Corey’s new book The Complete Trading Course (Wiley Finance) is now available along with the newly released Profiting from the Life Cycle of a Stock Trend presentation (also from Wiley).

2 Comments
Comments are closed.