April Pullback Retracement Play in Facebook FB
Facebook (FB) shares face a major “make or break” support challenge at a key opportunity level for traders.
Let’s set the chart up to plan a potential “support bounce” or “alternate trend reversal breakdown” play for FB.
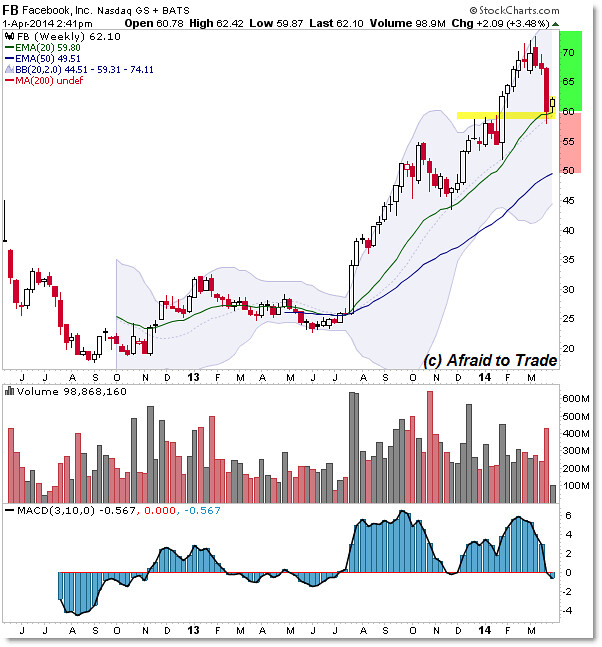
We’ll start with the broader Weekly Chart for a top-level reference:

We see a strong uptrend took shares from the $25.00 per share level in 2013 to the recent 2014 peak above $70.00 per share.
A weekly chart or steep retracement (sell-swing) took price to the potential support of the rising 20 week EMA into $60.00 per share ($59.80 at this moment).
That’s where we’ll focus our attention as we plan a potential support-bounce play off this level.
Keep in mind that a failure or immediate breakdown under the $60.00 per share level opens a downside pathway toward $50.00 per share as an “alternate breakdown” thesis.
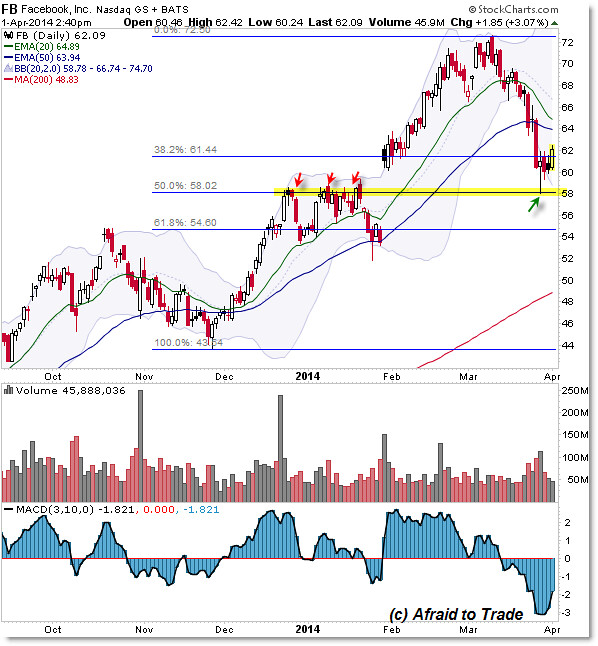
The Daily Chart reminds us why $58.00 and $60.00 are the current focal prices:

We’ll start with the small “triple top” or horizontal resistance through January 2014.
Next, we’ll incorporate the rising 20 week EMA (near $60) with the 50.0% Fibonacci or “halfway point” of the November to March recent rally ($58.00).
Note the spike reversal candle develop from the underside of this pivot level.
It’s simplified analysis/strategy, but we’ll look for a continuation “support bounce” play up into the 20/50 day EMA cross-over level near $64.00 for an initial target, and then a breakout through EMA resistance to open a target pathway toward the $72.00 divergent high from earlier in March.
Keep these simple yet overlapping levels in mind when planning trades in Facebook (FB) stock.
Follow along with members of the Daily Commentary and Idealized Trades summaries for real-time updates and additional trade planning.
Corey Rosenbloom, CMT
Afraid to Trade.com
Follow Corey on Twitter: http://twitter.com/afraidtotrade
Corey’s new book The Complete Trading Course (Wiley Finance) is now available along with the newly released Profiting from the Life Cycle of a Stock Trend presentation (also from Wiley).


You focus so much on the down side it makes me think you are biased and thirsty for a $50-$55 trade. You had your chance at $57.98. Give it up with all this technical mumbo jumbo. Technicals can bite you on the ass as today's action proves. Good luck.
I'm focusing neither on the bull or bear side but the possible inflection or pivot price as highlighted. Try to remain objective.