Are You Seeing this Stealth Move in Bonds TLT?
Pop Quiz – would you have made more money holding bonds all of 2014 or stocks?
Easy, right? Stocks made many new all-time highs throughout the year and advanced 13% for a great year.
Did you know bonds – at least measured by tradable ETF TLT – almost doubled that gain? It’s very hard to believe.
But it’s true.
Here’s the chart and the stealth bull market secretly strengthening in the US bond market:

If you invested $100,000 in the SPY (or rough equivalent US equity ETF) at the beginning of 2014 and sold at the end, you would have gained roughly $12,000 (not including dividends).
That same investment in the TLT bond fund – normally something you would AVOID if you expected a bullish stock market – would have gained you almost $23,000.
I believe this to be one of the most fascinating, unexpected and underreported facts of the markets in 2014.
From the percentage-based chart above, while the S&P 500 had five pullbacks (retracements) in 2014, bonds gained strongly each time stocks pulled back.
The key factor in the strength in bonds was that bonds really didn’t retrace or give much ground all year (except September and October).
In other words, bonds stayed strong almost all year, rallying as would be expected during sell-swings in the stock market… but also rallying right along with stocks during periods of bullish money flow into US equities.
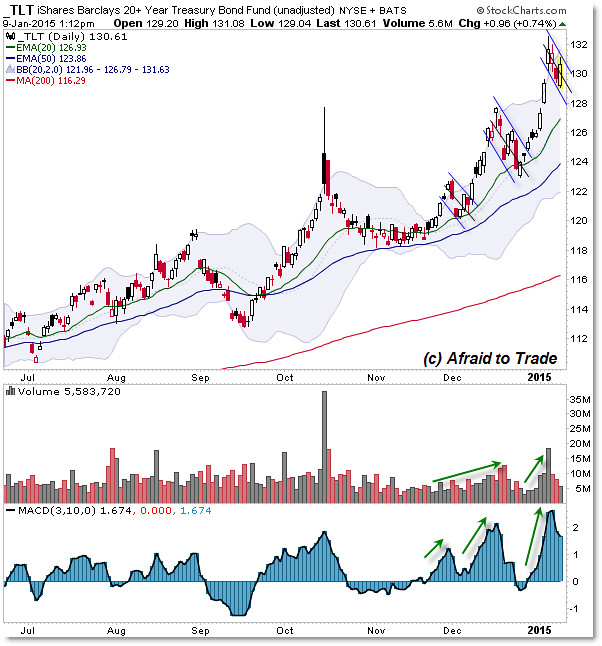
Yet here we are with the TLT at new highs and continuing a strong and enviable bullish trend:

The end of 2014 saw three small bull flags occur in price, vaulting price to new highs above $130.
Let’s step back and view the larger picture, spanning the 2008 stock market crash and beyond:

I could ask a different question:
“Given that stocks and bonds often do well in periods of stock market turbulence, is the bond market generally higher or lower than it was at the worst part of the 2008 financial crisis and bear market in stocks?”
Once again, we’ll be surprised to learn that bonds – measured by TLT and related ETFs – are at new highs, well-above the temporary spike higher.
For some additional perspective, take a moment to view my prior post “Five Insights Only Monthly Charts Can Reveal to You.”
The same can be said about bonds.
With stocks once again near all-time highs in what’s been deemed “the most hated bull market of all time,” you would simply assume that bonds must be making new lows or downtrending as stocks continue their uptrend.
But that would be very wrong.
Again, this is one of the most fascinating facts of 2014 and it could continue as 2015 unfolds.
Follow along with members of the Daily Commentary and Idealized Trades summaries for real-time updates and additional trade planning.
Corey Rosenbloom, CMT
Afraid to Trade.com
Follow Corey on Twitter: http://twitter.com/afraidtotrade
Corey’s book The Complete Trading Course (Wiley Finance) is now available along with the newly released Profiting from the Life Cycle of a Stock Trend presentation (also from Wiley).


It’s very risky to trade on bonds especially for beginners. I rather put my money on currency pairs or commodities as there I have a strong chance of success. Also, I like doing long term trading so I get good chance of able to seeing both side of the movement to make nice profits for me and it is all due to OctaFX broker’s lovely swap free account that is available for every single trader whether he is a religious person or not.