Back to a Key Pivot Point for Swing Trading Apple AAPL Nov 28
Does Apple (AAPL) go higher or lower from $110? Build your next swing trade off this logic:

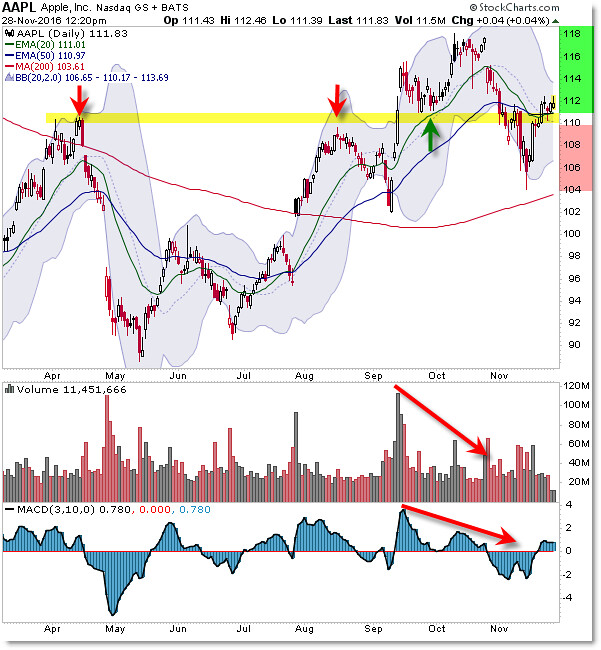
Apple shares logically tumbled from the $118.00 level on dual negative volume and momentum divergences.
Price extended itself away from the 200 day SMA (red line) and then collapsed back toward it in November.
At the moment, we’re seeing a rally “up away from” the 200 day SMA ($104) now back into the critical “midpoint” pivot.
It’s also a critical Bull/Bear (Buyer/Seller) reference level as you can see with the red and green arrows and prior turning points for the stock.
It was resistance twice and support once previously in 2016.
What’s going to happen now? That’s where your trades come in!
A continued breakout above $112 suggests shares will rally back toward $118 (green zone) while a future breakdown beneath $110 suggests a bearish pathway instead will pull price back toward the 200 day SMA.
Don’t predict – plan and trade the immediate departure “away from” the $110 pivot.
Follow along with members of the Afraid to Trade Premium Membership for real-time updates and additional trade planning.
Corey Rosenbloom, CMT
Follow Corey on Twitter: http://twitter.com/afraidtotrade
Corey’s book The Complete Trading Course (Wiley Finance) is now available along with the newly released Profiting from the Life Cycle of a Stock Trend presentation (also from Wiley).”

