Bull Flag Formation in the US Dollar January 18
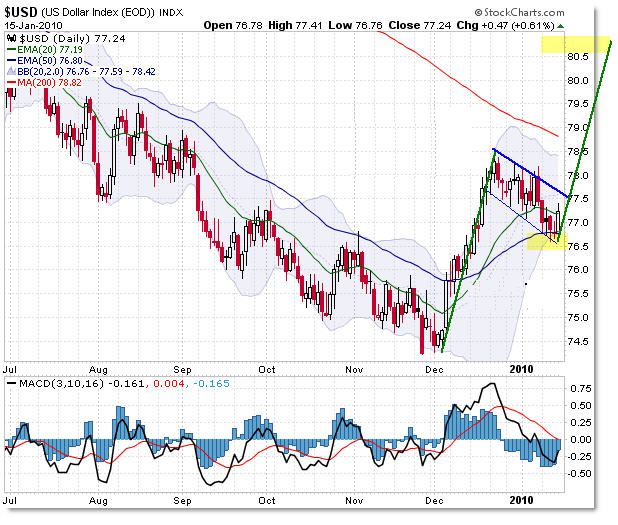
There is a distinct possibility that a Bull Flag pattern formation is setting up currently in the US Dollar Index, and we should know for sure by the end of next week if not early into the following week as to whether this set-up will be confirmed (triggered) or not.
Let’s take a quick look.

Starting with the December lows of $74.50, a $4.00 impulse formed which took price to the $78.50 level.
Now, price has retraced $2.00 to the support level at $76.50 (50 day EMA) and now appears to be mounting a move that could take price to the upper “flag” target at the $80.50 level (add $4.00 to the likely flag low at $76.50).
A similar surge in the US Dollar would be seen as bearish for gold and crude oil prices (in fact, gold prices appear to be forming an opposing bear flag on its daily chart).
I just wanted to highlight this potential quickly, and note that a move higher than $77.50 and especially $80.00 would confirm the bull flag pattern and the expectation for a move to take price to the $80.50 target.
However, a move from here that continues to swing downward through the $76.50 support area – and especially beneath $76.00 – would undermine and invalidate the flag pattern.
Even if you’re not trading this, it should be interesting to follow in the week(s) ahead!
I discussed this along with weekly and monthly charts of the five major markets in this week’s Weekly Intermarket Report.
Corey Rosenbloom, CMT
Afraid to Trade.com
Follow Corey on Twitter: http://twitter.com/afraidtotrade

yeeea
yeeea