Bullish Breakout Brewing for Apple AAPL?
Is Apple (AAPL) about to break through resistance to trigger a short-term buying opportunity?
Let’s update our Apple (AAPL) charts and highlight the key levels to watch for traders:

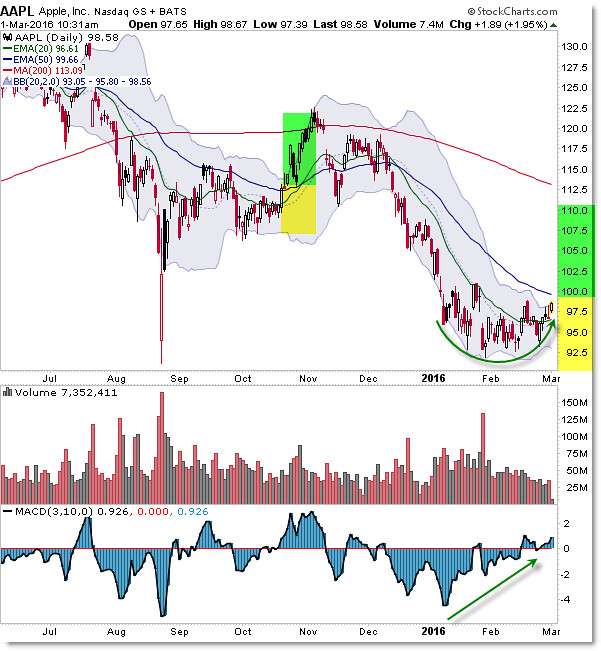
We’re seeing the Daily Chart as a Downtrend continues for Apple shares.
However, let’s look at the October into November period where a similar pattern (opportunity) developed.
We had a “Rounded Arc” pattern on positive divergences into the $107.50 per share level.
Price rallied up toward the falling 50 day EMA (blue) and then broke impulsively higher in a “short-squeeze” rally into $122.50.
Ultimately the downtrend continued, but let’s not get ahead of ourselves.
Now, we’re seeing a similar “Rounded Arc” pattern form off $92.50’s support with price rallying once again toward the falling 50 day EMA into $100.00 per share.
A big breakout above $100 likely triggers a repeat “short-squeeze” bullish impulse and thus bullish trading opportunity.
Note the yellow “Neutral Zone” beneath $100.00 and the short-term trading range between $92.50 and $100.
Short-sellers have another opportunity to short the stock under $100.00 but would stop-out above $100.
The “stop-out” and new buyers (entering above $100) could be a catalyst for another bullish breakout like we saw into November 2015.
Watch the $100 level and plan or trade accordingly!
Corey

