Buying and Trading Levels for Amazon AMZN
What levels are key for traders in Amazon.com (AMZN) now?
Based on these levels, what are the “Price Planning Pathways” to targets?
Let’s start with the Daily Chart and update our trading levels:

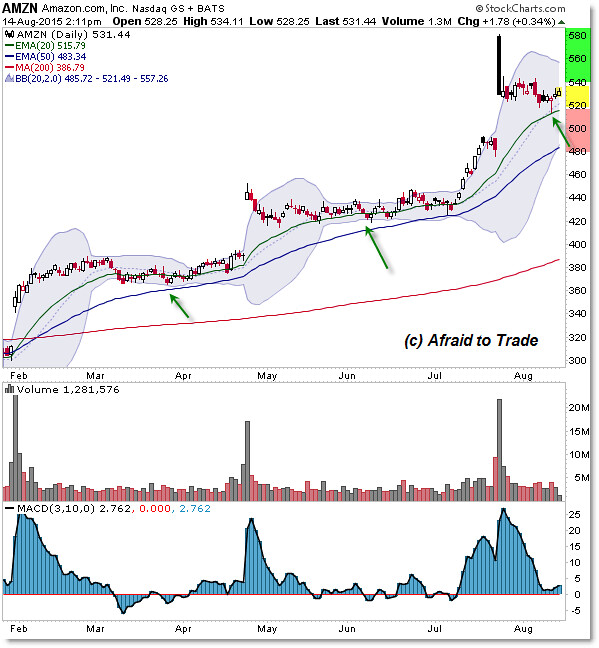
Amazon.com (AMZN) developed a “Gap and Consolidate… then Rally” Pattern through 2015 as drawn.
After an initial earnings gap, shares consolidate and support on rising moving averages.
The next “swing” or pathway has been an upward rally into the future.
We’re balancing the odds of this pattern repeating a third time on the July “gap and consolidation.”
If so, notice the support reversal candle off the $520.00 per share level at the rising 20 day EMA.
We’ll be “bullish” above the $520 pivot and “breakout trigger bullish” above $540.
A bearish sell pathway develops under the 20 day EMA near $520.
Let’s zoom-in the perspective to see these levels closer:

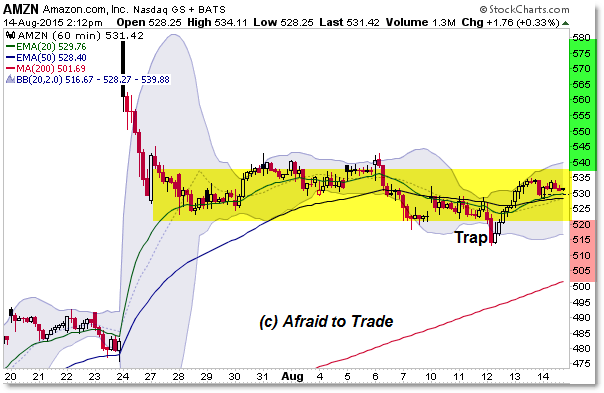
A quick glance at the Hourly Chart of Amazon (AMZN) reveals the sideways rectangle range between the simple, easy-reference levels of $520.00 for support and $540.00 for resistance.
We’ll continue playing “Ping-Pong” with price between this range as detailed.
However, a firm upside breakout on higher volume above $540 and $543 could trigger another bullish swing higher toward $570 or beyond – it’s the Bullish Price Pathway.
Otherwise, we do note one “Bear Trap” under $520 that was immediately bought and supported.
Like a Magnet, the $530 level is the Midpoint Reference Level for price.
In the alternate thesis event that price does break and sustain under $520, then a “Bearish Sell Pathway” opens to traders down toward $500.
Focus on the hourly chart levels when planning and trading Amazon here.
Follow along with members of the Afraid to Trade Premium Membership for real-time updates and additional trade planning.
Corey Rosenbloom, CMT
Afraid to Trade.com
Follow Corey on Twitter: http://twitter.com/afraidtotrade
Corey’s book The Complete Trading Course (Wiley Finance) is now available along with the newly released Profiting from the Life Cycle of a Stock Trend presentation (also from Wiley).


These levels are definitely important for everyone if we can judge it correctly, I don’t have too much experience about these yet I do follow charts well and that’s because of massive advantage that I get with OctaFX broker on their cTrader platform where all my trading orders are executed instantly plus there is so much help to do analysis much better with the advance charts and upgraded system, so that makes trading all so much easier to do for anyone.
It is very important that we are careful working out with
these levels since that can make huge difference in profit and losses, so we
need to be pretty certain about all these levels before going on, it’s the way
we can get favorable results. I love trading with these setup given that I am
using the latest platform in cTrader provided by OctaFX, it’s created for ECN
trading and really makes my life easier due to highly advance setup.