Charting the Breakdown in 10 Year Treasury Yield and Stocks
Intermarket analysts look to the relationship of the Bond and Stock Markets for clues of future moves in these markets, paying close attention to leading signals when they occur.
This week gave us a firm breakdown in the Ten-Year Treasury Note Yield which resulted in a subsequent break-out in Bond/Note prices, such as in TLT and IEF (funds).
Let’s take a look at these moves and tie it all together with relation to the S&P 500.
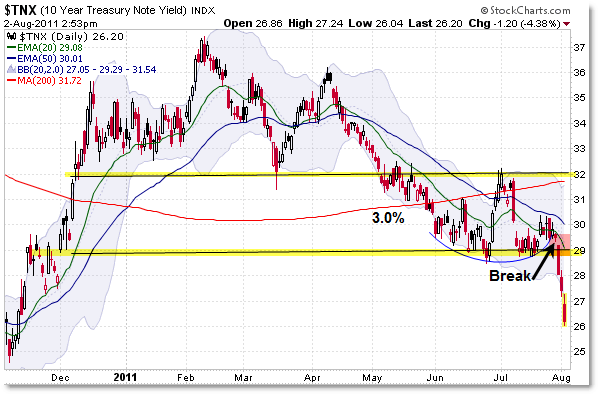
First, the pure 10-Year Note Yield Chart ($TNX):

I’m showing the Yield as a candlestick chart – others show it as a line chart. The right side of the chart represents YIELD, as in 30 is actually a 3.0% yield.
The current support from June to July broke this week at the 2.9% level which resulted in a three-day sharp decline in the Treasury Yield.
You can see that the Yield also broke the 3.2% level in May which was the prior yield support level.
Let’s turn to the breakout in price in related ETFs:

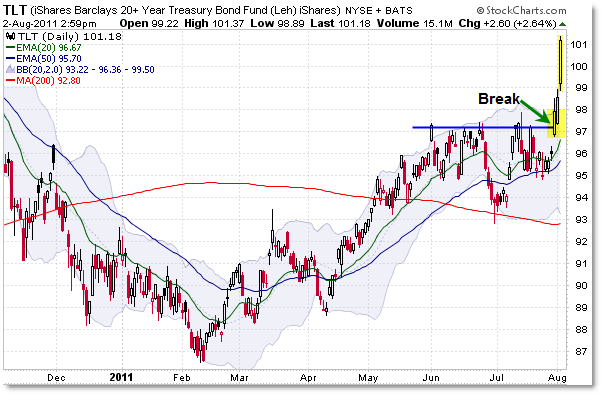
We’re seeing the popular TLT Bond Fund (ETF) which many short-term traders (or even investors) use when they want to play a move in the bond market without purchasing physical bonds.
The comparable fund to the $TNX (Ten-Year Note) is IEF, so be sure to view that fund as well.
In the TLT, resistance formed at $94 which firmly broke last Friday, giving us the current three-day sharp breakout rally.
The big turn in sentiment – outside of the US Congress avoiding default – came on a series of worse than expected economic reports, which turned the focus back to the weakening economy.
Investors seem to have scurried away from stocks and into bonds, which has resulted in both a breakout in the Bond market and a potential breakdown in the stock market.
Speaking of the Stock Market, the Bond and Stock Markets are inversely correlated, which makes Bond/Note Yields positively correlated with Stocks.
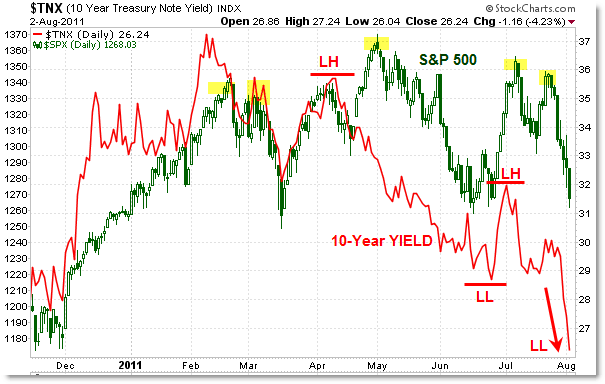
Here is a current picture of the Intermarket Relationship between Stocks and the 10-Year Yield:

You can see how the 10-Year Yield tracks alongside (positively) with the S&P 500 in the up-and-down price swings.
However, you can also see that the Yield (red) formed a Lower High (“LH”) in April and then pushed to a lower low in June while Stocks (green) pushed to a higher high and higher low.
This is an Intermarket Non-Confirmation and potential warning sign from the 10-Year Yield. Bonds have a tendency to lead stocks at key market turns.
During the recent swing to 1,350 in July, the 10-Year Yield formed a corresponding lower high at 3.2% before breaking firmly under the 2.9% support shown in the chart above.
Stocks have not yet broken their critical support at the 1,250/1,260 level, but they have already broken their 200d SMA key support. A breakdown under 1,250 would likely be seen as a very negative sign for the stock market.
This is something to watch closely – the sudden breakdown in the 10-Year Treasury Yield which corresponds (presently) with a 7-day decline in the S&P 500.
Watch these markets in conjunction along with the S&P 500 and Dow Jones at their critical/key Make-or-Break levels.
Corey Rosenbloom, CMT
Afraid to Trade.com
Follow Corey on Twitter: http://twitter.com/afraidtotrade
Corey’s new book The Complete Trading Course (Wiley Finance) is now available!

Thanks Corey – your analysis is awesome!
Last week, Suzlon sold its 26 percent stake in Hansen to Germany's ZF Friedrichshafen AG for USD 187 million and plans to use the funds to cut its estimated debt of Rs 123 billion (USD 2.8 billion).
Suzlon also plans to take full ownership of REpower Systems after raising its stake to more than 95%, which analysts have said will allow it to access technology and cash on the German firm's books.
“We have kept the focus on technology, which is paying now. We have optimised our cost structures, and we are positioned very well in high-growth markets,” Tanti said.
Its key products include REpower's huge offshore turbines, where its main rival is Germany's Siemens.
Suzlon raised USD 175 million in a convertible bond issue in April. Macquarie said in a note that Suzlon can “easily” repay USD 650 million in debt principal that comes due in 2012, with cash from REpower after it takes full control, and proceeds from the Hansen sale.
One of my fundamental analysis friends insists the falling $tnx is indicative of the beginning of an inverted yield curve, which indicates a recovery ahead. I'm just a trend follower and can't understand his logic. I see falling interest rates as a rise in bonds (panic to safety).
Yay for moving averages. No arguing with an EMA 10, 50, and 200 day.
Alan Greenspan said on Squawk Box watch the Ten year and you will know what the economy is doing