Charting the Key Resistance Level in Daily Crude Oil
In general, crude oil prices are closely following stock prices, including the recent rally into confluence resistance.
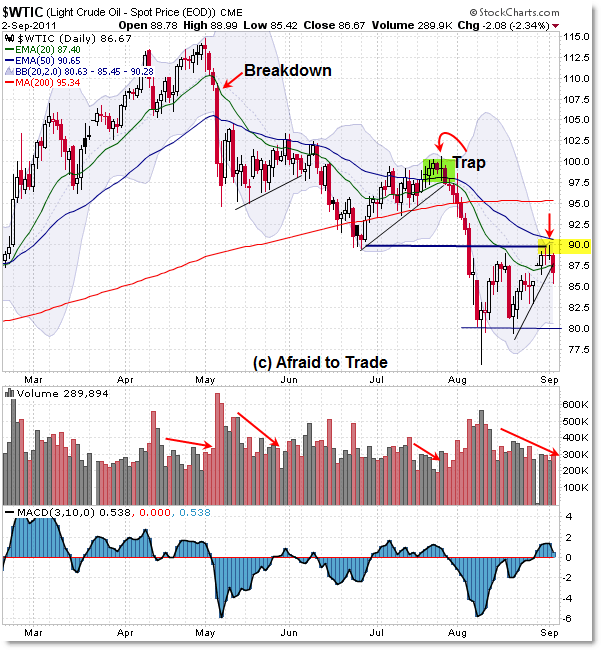
Let’s chart that key resistance level to watch on the daily chart in Crude Oil:

Let’s start with the current structure and then take a moment to learn a few charting lessons from similar set-ups in the last few months.
Reference my prior update on the S&P 500 Resistance/Reference level for a lengthier explanation of this type of ‘retracement into resistance’ logic.
The main idea is that we have a dual type of simple confluence resistance shaping at the $90.00 per barrel index level.
Why?
The falling 50d EMA resides at $90.65 which forms a near confluence with a prior swing low at $90.00 from June 2011.
Does that mean price is required to fall down at this confluence resistance? No, but so far, the downward swing is playing out as suggested by the overhead confluence resistance area on the chart.
Should the swing lower continue – which would be similar in the stock market – the next logical downside target would be the $80.00 price level which is just under the closing lows for 2011.
A firm breakthrough close above $92.00 invalidates this bearish swing in motion, however.
Prior Examples of Similar Retracements
Speaking of unexpected breakthroughs, let’s step back to late July 2011 where price formed a similar retracement swing into the overhead resistance of the falling 50 day EMA at $97.50.
Price stagnated here and then slipped above the falling 50d EMA, surging to the more important price reference level at $100.
Traders who shorted into the 50d EMA were trapped just ahead of the downward impulse they were expecting.
Ultimately, sellers defended the $100 level ahead of the sharp decline into August.
For fun, we can reference two similar small retracements into the falling 50 day EMA in early June – both of which resulted in downside price action.
Trading Retracements in Trends
In general, it’s safer to trade retracement plays/set-ups into overhead resistance in the context of a trending market – in this case, a daily chart downtrend.
The stop-loss is often located just above the expected resistance which allows for a relatively small/tight stop when compared to the larger target of a move to test a prior swing low or even go beyond (lower) than the prior support.
If anything, this is the type of logic that is helpful in setting up your own trading ideas/game-plan in any market or timeframe – Crude Oil is just giving us a nice example at the moment.
Corey Rosenbloom, CMT
Afraid to Trade.com
Follow Corey on Twitter: http://twitter.com/afraidtotrade
Corey’s new book The Complete Trading Course (Wiley Finance) is now available!

Corey,
I just want to say thank you fo your always very interesting and helpful studies! I read your book which is one of the best I know – and I read quite a few!
Regards
Thomas
Great chart and analysis…I actually think with the move down this morning in Oil some of the OTM puts on USO and OIH are going to jump significantly over the next couple of days and could be really good trades shorting the volatility on these.