Checking SP500 Market Internals and Price Pathways at the Highs
With the SP500 closing at all-time highs, let’s take a look at Market Internals and plot two Price Pathways for trading either a breakout or retracement outcome into known and obvious resistance.
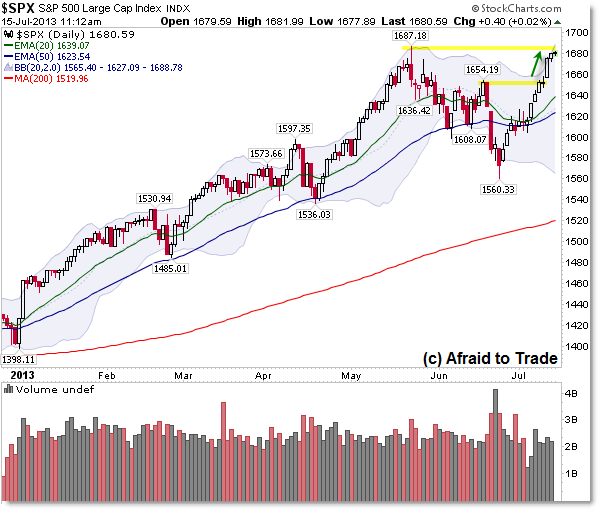
We’ll start with the SP500 Daily Chart itself:

The main idea for swing trade (or even intraday) planning is that the SP500 is trading above the all-time closing high (1,675) but under the 1,687 “all-time” intraday spike high and has two possible outcomes at the current level:
A Breakout Event Thesis calls for another ‘straight-up’ impulse toward then probably above the 1,700 “Round Number” Reference Level. Price would accomplish this outcome thanks to short-sellers buying-back to cover losing positions (short-squeeze) which would join with bulls buying on the breakout or adding to existing positions.
The Retracement/Consolidation Thesis suggests buyers will take profits and sellers will step in at the current levels, preventing a breakout and thus resulting in a retracement toward the 1,655 prior swing high and breakout level.
Note the last time we had the same parameters (planning price pathways) was into the 1,655 prior swing high (note the Doji candle from July 10) and as the index traded above the 1,655 key level, a sudden impulse propelled the market straight up to the current target level into 1,675 then 1,687.
It is entirely possible that the current scenario results in yet another bullish breakout toward the 1,700 Round Number Target.
With those two main scenarios (price pathways) in mind, let’s turn to Market Internals for clues:

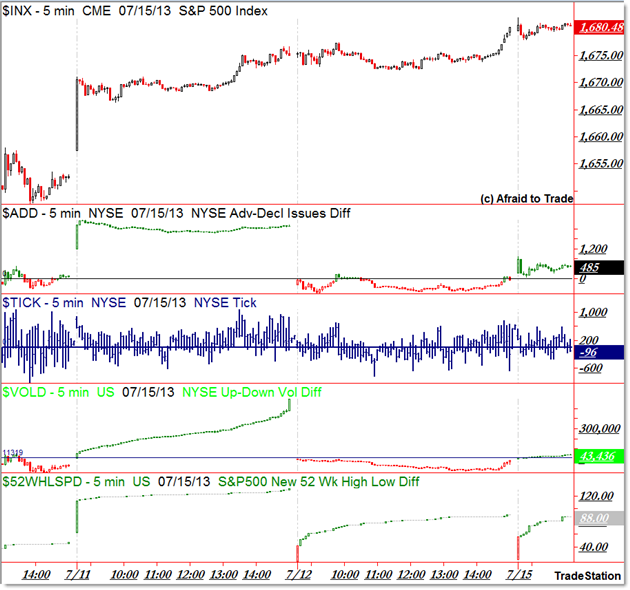
We’re seeing the SP500 Index with Breadth ($ADD), NYSE TICK ($TICK) and Volume Difference (advancing minus declining – $VOLD) as the “Big Three” Market Internals.
I highlighted the prior Divergence Event from July 3rd (half-day session) and since then, there haven’t been any major divergences between Price and Internals.
I did want to emphasize the two days of Bullish Strength or strong confirmation with Price and Internals (green highlight) which tends to forecast higher prices yet to come (that indeed did happen).
Let’s take a closer look at the Market Internals that are ‘undercutting’ or failing to confirm today’s new swing high above 1,680:

Taken in order:
NYSE Breadth is lower than its 2,351 recent peak achieved on July 11th. Breadth currently registers just under 500 issues.
NYSE TICK indicates a lower high than its July 7th intraday high of 1,081. Compare TICK highs with price highs – today’s current TICK high was 580.
VOLD also registers a lower reading than its July 7th peak near 600,000. VOLD tends to follow the trend of the day so it’s most effective to compare closing values yet today’s reading is near 50,000.
Finally we have a new indicator – the Difference between stocks in the SP500 achieving new 52-week highs and those achieving new 52-week lows. The current value is 88 stocks which is lower than the end-of-day peak of 132 from July 11th.
Internals suggest a “Retracement/Pause” outcome but remember, internals are simply indicators that help assess probabilities of one outcome occurring over the other.
As traders, we need to develop a “Dominant Thesis” and “Alternate Thesis” and be ready to trade the alternate thesis or ‘unexpected outcome’ should it develop.
While Internals do argue for a pause into current levels, do be fully aware that another breakout event would likely result in a wave of bearish stop-losses triggering, thus propelling the market straight up again as was the case from the breakthrough above 1,655 (without a meaningful pause at that level).
Follow along with more analysis/commentary like this by joining our membership services for daily or weekly commentary, education (free education website), and timely analysis.
Corey Rosenbloom, CMT
Afraid to Trade.com
Follow Corey on Twitter: http://twitter.com/afraidtotrade
Corey’s new book The Complete Trading Course (Wiley Finance) is now available along with the newly released Profiting from the Life Cycle of a Stock Trend presentation (also from Wiley).

Through anticipation of one last grand finale burst of Inflationism in front of Summer Earnings Season, the twenty most inflationary ETFs rose strongly to new rally highs; these being, BPOP, KRE, IBB, FDN, CARZ, PBS, IGV, RZG, RZV, PSCI, RXI, PBD, IYC, PPA, RWW, IAI, SPHB ,SMH, XRT, and PJP, seen in this Finviz Screener … http://tinyurl.com/m4rrz95 … of note, most all of these turned lower on Tuesday July 16, 2013. Could it be that these constitute a tremendous short selling opportunity?
An inquiring mind asks, did an Elliott Wave 3 Down commence in the S&P 500, $SPX, SPY on Tuesday July 16, 2013? Did Risk-On, ONN, turn to Risk Off, OFF, with Volatility, TVIX, VIXY, VIXM, and XVZ, rising, as seen in their ongoing Yahoo Finance Chart? http://tinyurl.com/l6dmzck
where are you getting the different market internal indicators from. i cant find any of those on stockcharts.com. are those from a different site? thanks