CRB Commodity Index Update July 13
I received a request to update the analysis on the CRB Index and I realized it’s been quite some time since I posted a CRB update.
Without further delay, let’s take an updated look at the weekly and daily CRB Index, a basket of commodities charted as a composite index.

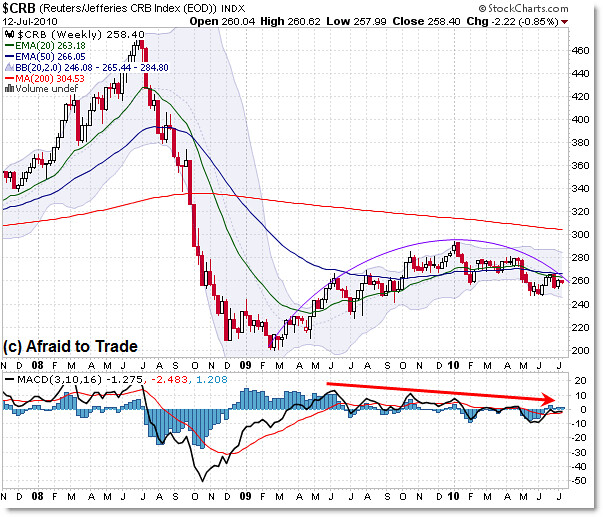
A quick glance shows us two chart points:
First, there is an “arc” or rounded arc formation that shapes the entire move off the February 2009 low to present, with the current price being on the declining phase of the arc pattern.
Second, we see the negative momentum divergence that undercut the rally in 2009, ending with a peak of 290 in January 2010 which then gave way to the recent “decline” phase to the 250 level in May.
Technically, the chart is in a ‘trading range’ or flat trend, so we don’t look to the moving averages as references, though the averages are in a bearish position… actually the most bearish orientation possible with the 20 under the 50 and the 50 under the 200. The EMA confluence held as resistance in June.
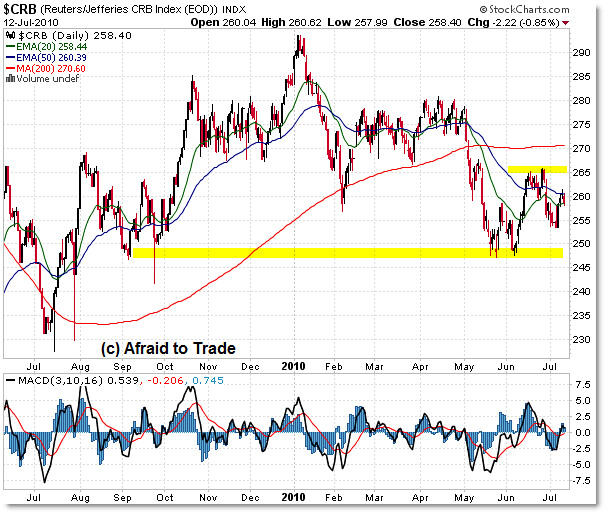
That’s the bigger picture, but what levels are important to watch short-term on the daily chart?

That’s easy – there are two short-term index levels to watch as clues for the next swing in the structure.
Index value 265 is the June high, so any break above that would correspond with a break above 1,130 in the S&P 500 to form the first higher high in the context of a confirmed short-term downtrend (lower lows, lower highs, and negative/bearish EMA structure).
In the absence of a bullish break above 265, which could lead to a continued upthrust to the resistance at 280, then we look to the 248/250 level that formed a double-bottom price pattern in May/June 2010.
This level corresponds with the 1,010/1,000 level in the S&P 500, and of course a break under here continues the bearish downtrend and likely sends the CRB lower to test the 230 level as the next expected target.
Thus, like the resistance level to watch in the S&P 500 (which are targets and inflection points), we need to watch 265 then 280 to the upside, and 245 as the ‘line in the sand’ support for the CRB Index.
Corey Rosenbloom, CMT
Afraid to Trade.com
Follow Corey on Twitter: http://twitter.com/afraidtotrade

CRB didn't make a new low when the S&P did, which was something to note. Also, despite the Eurozone troubles, many of the stock markets also did not make new lows with the S&P.
Thank you for the post. I’m still learning from you, but I’m improving myself. I absolutely love reading all that is posted on your site.Keep the information coming.I liked it!
Thanks for sharing.
Commodity Market