Crude Oil at the $70 Level Gives a Finger… Trade
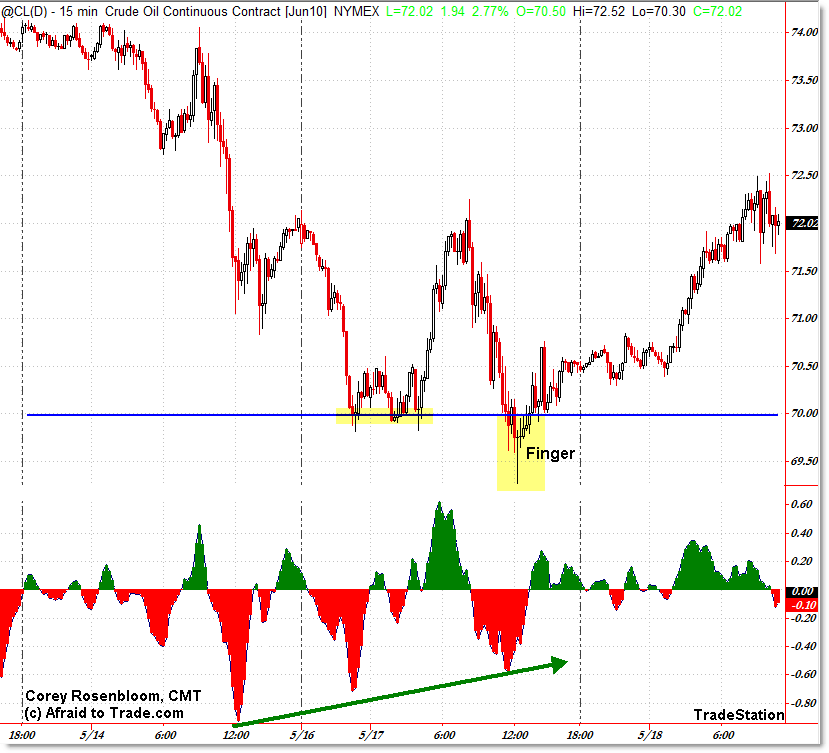
I posted yesterday about the importance of the $70.00 level as a “Line in the Sand” Support area for Crude Oil. Yesterday, price tested and – so far – held that level, developing a triple-swing positive momentum divergence along with a classic “Finger” Trade set-up/resolution.
Let’s see those and the current intraday oil chart:
Reference back to my prior post entitled:
“Weekly Perspective and Levels to Watch on Crude Oil” for the broader picture behind why $70.00 is so important.
Notice how price first hit $70 then bounced off that level early in the session of May 17. Look closely at the positive momentum divergence, using the 3/10 Oscillator (color version), that formed at this level. For aggressive traders, that was an initial buy signal with a tight stop just under $70.
The trade worked temporarily, as oil futures rallied to the $72.00 level, and so traders assumed that we were perhaps seeing a reversal in crude oil at the critical level.
Not so fast!
Sellers struck one more time, taking oil suddenly under $70 (down to $69.50) but this time on an even more noticeable positive momentum divergence, into what I like to call a “Triple Swing” positive momentum divergence.
Price also formed a vicious reversal candle – notice the dragonfly doji (long-leg candle) at noon.
This was your classic “Finger” Trade set-up, which I described most recently as ‘popping up’ in the S&P 500 on May 11th (the peak of the retracement and beginning of the downward reversal).
If this ‘finger’ in oil is similar to the prior ‘finger’ in the S&P 500, then we could see a reversal continue up and drive price off the critical support level at $70.00.
We’d need to see a break above $72.50 to have further confidence that support will hold. Notice the mini-negative momentum divergence that just set-up as we tested this resistance level. That makes the $72.50 level a short-term/intraday level to watch.
For additional analysis, join our Weekly Inter-market Report service, which also takes a multi-timeframe view of key markets and opportunities like this.
Corey Rosenbloom, CMT
Afraid to Trade.com
Follow Corey on Twitter: http://twitter.com/afraidtotrade


Oil and Oil stocks have followed the market recently. So it's not surprising to see them pullback with stocks. However, the S&P 100 Point & Figure bullish percent index has produced a significant short term buy signal last Friday. As such, I expect stocks to rally in the next several weeks. Also, oil should follow stocks. I'd look to play the oversold bounce in the oil sector here.