Crude Oil Finally Catching a Bid off Support with Divergences
One of my favorite short-term trading set-ups is the concept of a lower timeframe multi-swing divergence into a known higher timeframe support level.
Crude Oil finally bounced strongly off support – after extending its positive divergence pattern – and we now monitor how high the bounce will take price.
Let’s take a look at this integrated pattern (higher frame support plus lower frame divergence) and what the updated parameters are currently.
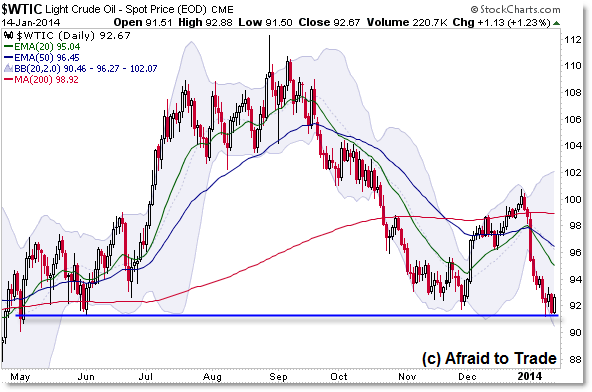
Here’s a basic chart of the higher frame key “make or break” support inflection pivot near $92.00:

As I’ve been highlighting in the weekend “Weekly Intermarket Planning” reports for members, our key focal point has been the $92.00 per barrel level which is a known “make or break” inflection price for crude oil (note the support bounces from mid-2013 as well as December).
For reference, the falling 20 day EMA intersects the $95.00 level which was the initial “bounce” retracement target.
Beyond that is the $96.50 target (falling 50 day EMA) along with Fibonacci Retracement levels I’ve drawn on the lower frame charts. Keep $95.00 in mind especially.
Let’s step inside the 15-min chart to highlight the initial targets and study the Divergence Pattern:

Again, incorporate the $92.00 zone with the Daily Chart above.
The 15-min intraday chart – along with the hourly which we’ll see shortly – revealed a lengthy or “multi-swing” positive momentum divergence developing since the oscillator low on January 2nd.
From there, as price itself pushed to new swing lows, the momentum oscillator slowly registered higher lows which form the basis of a simple divergence.
Simple divergences do not reverse trends, especially strong ones, so we need to see the divergence stretch out or extend over time relative to the new price lows as we see in the 15-min chart above.
I drew a short-term Fibonacci Retracement (target) Grid from the December high above $100 to the recent January low under $92.00 to reveal the initial upside target (38.2% FibonaccI Retracement) into $95.00 per barrel.
Note again the confluence or overlap with the falling 20 day EMA target.
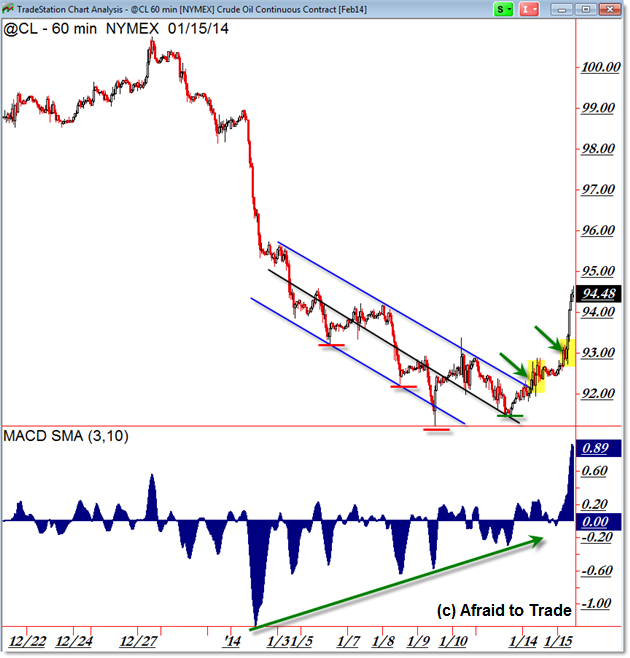
I highlighted the two breakout or bullish entry trades that developed as price pushed up off this inflection level (the initial break of the falling intraday trendline and the break above the prior swing high into $93.00).
Very aggressive traders can “risk it” by establishing a position as close to the higher timeframe support as possible ahead of the ‘trigger-break’ signal. Keep in mind that price in a trend can continue despite what divergences or other indicators suggest.
Note the initial power-swing up off the $92.00 level that fell victim to an initial retracement to retest – but not break under – the price low from January 9th.
For a broader view – including overnight data – let’s view the hourly chart and its divergence pattern:

The hourly chart gives us a clear, indicator free perspective of price, trendlines, trendline breakouts (trade entry triggers) in conjunction with the multi-swing momentum divergence.
Monitor positions into the initial $95.00 per barrel target (achieved on the first impulse up) and look to additional upside potential on a trigger-break above $95.00.
Otherwise, we draw our attention to the $95.00 level as the key planning level for traders.
Follow along with members of the Daily Commentary and Idealized Trades summaries for real-time updates and additional trade planning parameters as we watch a “hold and bounce” or “break and retrace” scenario play out in the near future.
Corey Rosenbloom, CMT
Afraid to Trade.com
Follow Corey on Twitter: http://twitter.com/afraidtotrade
Corey’s new book The Complete Trading Course (Wiley Finance) is now available along with the newly released Profiting from the Life Cycle of a Stock Trend presentation (also from Wiley).


Pretty! This has been a really wonderful post. Many thanks for providing these details.
What’s up too every , as I am actually keen of reading tthis webpage’s post to be updated on a regular basis.
It consists of pleasant data.