Daily Charting the Dollar Breakdown and Gold Bullish Breakout
Let’s expand the perspective on today’s “Dollar Drop and Gold Breakout.”
The two charts below compare the divergent Daily Trends of the Dollar and Gold:
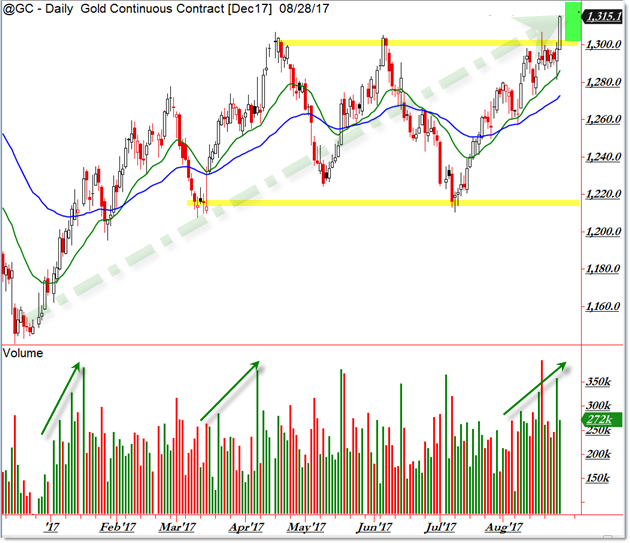
Gold surged in early 2017 off the $1,150 price pivot quickly toward the $1,300 target.
From there, an $80 sideways trading range developed, allowing us to play “ping-pong” trades between these support and resistance levels.
Instead of falling down a third time from our target, Gold buyers triggered a breakout this morning, initiating a “short-squeeze” with bullish activity.
The picture is the exact opposite in the US Dollar Index:
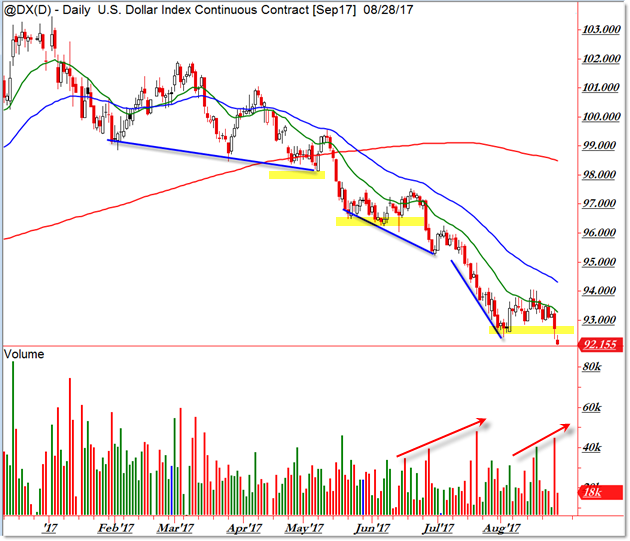
We see “Angles of Descent” follow the price lower. Note how the downtrend accelerated through 2017.
Odds seemed to favor a bounce up away from the 92.50 target but that didn’t materialize today, and Friday gave us a good clue (with the strong sell day) that sellers had the strength to shatter this proposed support level.
Now the index trades beneath support at a fresh new 52-week low.
Unless these two events are one-day traps, look for these trends to continue with breakout events.
Come join us to learn these tactics (beyond this simple/quick update) and have an evening game plan you can use effectively for the next trading day.

Follow along with members of the Afraid to Trade Premium Membership for real-time updates and additional trade planning.
Corey Rosenbloom, CMT
Follow Corey on Twitter: http://twitter.com/afraidtotrade
Corey’s book The Complete Trading Course (Wiley Finance) is now available along with the newly released Profiting from the Life Cycle of a Stock Trend presentation (also from Wiley).”