Did Stop Losses Help or Hurt the Simple Keltner Channel Breakout Strategy?
In the previous research post on “Buying or Fading a Keltner Channel Breakout,” I described a simple breakout (or ‘fade’) strategy and revealed the performance metrics on the strategy.
In this post, I wanted to dig a little deeper to see if we could reduce some of the larger losing trades and try to enhance the performance of the strategy by adding a stop-loss exit varialbe which was absent in the previous simple test.
Did adding a stop-loss into the system help or hurt overall performance? If so, was the effect small or large (worth it or not?).
You might be very surprised, and yes the effect was large.
Be sure to refresh the data by viewing the earlier post before comparing metrics in the current update.
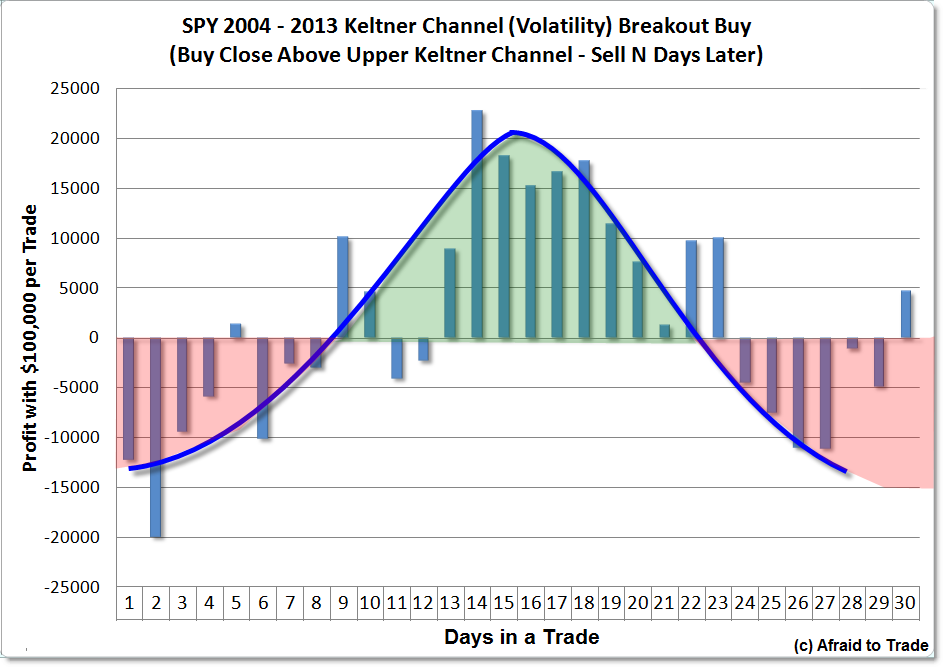
In the prior update, we saw that net profitability resembled a bell curve with respect to time in a trade (number of days holding a position that triggered).

We entered long (bought) when price broke and closed above an upper Keltner Channel (20 period lookback with 2 ATR to define bands) in the SPY from 2004 to 2013.
The system returned that the net profitability was best – and relatively stable – from day 14 to 18.
Net profitability was best holding a position for 14 days.
Now, let’s add two types of simple stop-loss strategies to see if we can enhance the net profitability, or specifically reduce the drawdowns.
While I tested 14, 15, 16, and 17 days, I wanted to show (for brevity) the performance metrics for holding an open position 14 days (because this returned the highest net profit).
The first strategy was to use a “Fixed Dollar Trailing” stop-loss, meaning exit the position if price moves down $2.00 from a peak.
If a trigger occurred and price moved $2.00 lower immediately, the position would terminate $2.00 lower.
If price moved up $2.00 and THEN traded down $2.00 (in SPY terms), then the position would terminate with a scratch (no gain/no loss).
And to make the test more robust – meaning I wanted to see the difference in a range of stop-loss variables, not just the arbitrary $2.00 stop loss – I ran the strategy 10 times with a Dollar Trailing Stop Loss of $1.00 all the way to $10.00.
While the data may reveal something absolutely counter-intuitive, let’s examine the results objectively:

The reason we run multiple tests is to find a pattern in the data. In other words, we don’t just run a single parameter (example – 10 days in a trade) and expect that outcome to reveal a complete picture.
The “1 – 10” Stops and Targets parameter (far left) means that we ran the same test as in our prior post but this time, each of the ten tests added a fixed dollar trailing stop ($1.00 stop, $2.00 stop, and so on).
What’s the very clear pattern?
The smaller the stop, the WORSE the system (net profit) performed; the larger the stop, the BETTER the system performed.
In fact, the data reveal a linear relationship where the worst metrics are with $1.00 then $2.00 and the best metrics flat-line from $7.00 on to $10.00 (where there is no change).
The fixed/flat-line in the data from $8.00 to $10.00 means that a stop-loss that large was never triggered in the system.
The data speak clearly – this system works best WITHOUT a stop-loss strategy. The tighter the stop, the worse the system performed.
Yes, this goes against conventional wisdom and the psychological comfort of using a stop-loss to prevent a small loss (losing trade) from morphing into a large loss, but remember that the strategy has a built-in stop-loss.
Any and all positions are sold at a fixed number of days after the position is entered – in this case, 14 days regardless of profit and loss.
A caveat – does this mean you should never use stop-losses? No, absolutely not, but within the context of this one simple strategy, stop-losses appeared to degrade performance to the point where the best results emerged from using no (or at least not a fixed dollar trailing) stop loss at all.
Why might this be?
To answer this question – and clear confusion – let’s compare two graphs from trade outcomes.
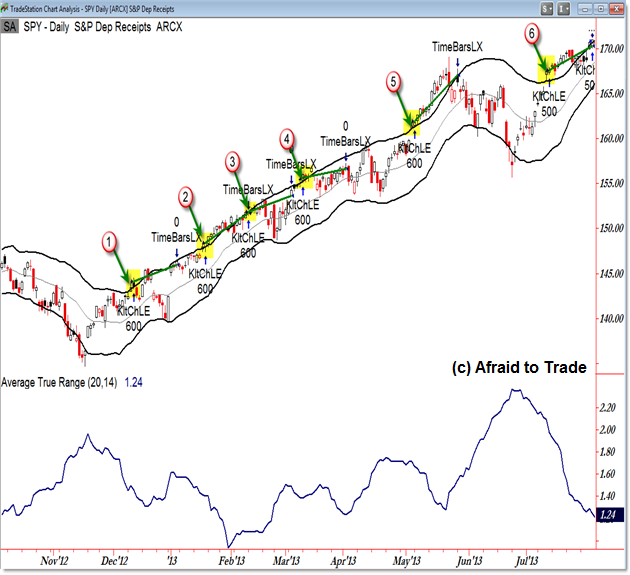
The first chart shows six triggered trades using the “buy a break and close above the upper Keltner Channel” strategy in the SPY during 2013.
In the context of a powerfully rising (impulsive) market, all six trades were profitable (holding 14 bars/days):

The chart above helps us step inside the data beyond Excel charts and text graphs. It helps us visualize what’s happening.
The second graph shows a ‘comfortable’ and acceptable $2.00 fixed dollar trailing stop as mentioned above.

While the first “no stop-loss” chart reveals six profitable trades, the second graph closes a position that falls $2.00 from a recent high (fixed dollar trailing stop) as an attempt to limit losses, particularly on failed trades (false breakouts).
While the “no-stop” parameter revealed six profitable trades in 2013, adding a $2.00 trailing stop actually turned a 100% win rate (six trades) into a 50% win rate (3 wins).
As if that weren’t enough, look closely at two of the three winning trades (Trade #2 and Trade #5). Both of these trades returned LESS profit than their no-stop counterpart in the chart above.
The only trade that returned the same outcome was Trade #6 (which was almost stopped out with the trailing stop as well).
Yes, these are a selection of 6 of the 50 trades triggered in a 10 year period, but they do reflect performance of a full year of data.
In all trades but one, profit declined (and in three of the six instances, a 14-day no-stop profit morphed into a financial loss).
If we examine all trades, we’ll certainly see instances where a large loss was ‘stopped’ by the fixed dollar trailing stop strategy – that’s precisely the goal of a stop-loss.
However, when researching a trading strategy, we look at the aggregate of all trading outcomes, not just one trade or one year of trades.
By comparing the two trade performance graphs of 2013, we can see how – using this strategy (particularly in a rising market) – adding a stop-loss strategy degraded performance overall.
Once again, the strategy itself has a built-in stop-loss parameter (number of days in a trade).
Keep in mind that back-testing is helpful and even necessary, but it does not imply that performance will continue into the future indefinitely (or exactly as it has during the back-tested period).
And before we risk money with any strategy, learn as much about the performance as possible, leaving your mind open to read the data objectively.
We’ll continue studying this topic and feel free to share your thoughts or insights from similar research.
Follow along with members of the Daily Commentary and Idealized Trades summaries for real-time updates and additional trade planning parameters as we watch a “hold and bounce” or “break and retrace” scenario play out in the near future.
Corey Rosenbloom, CMT
Afraid to Trade.com
Follow Corey on Twitter: http://twitter.com/afraidtotrade
Corey’s new book The Complete Trading Course (Wiley Finance) is now available along with the newly released Profiting from the Life Cycle of a Stock Trend presentation (also from Wiley).


Hi Corey, I'm curious where and how do u test this “buy above sell n days later” ?
Tradestation ? If so can it test like how Dr Steenbarger always quantify on his blog example..
Elson,
Thank you for your comment. I used the default Keltner Channel Strategy that (I believe) is part of TradeStation itself (I didn't program it). I did alter the parameters of the default “Keltner Channel Long Entry” (Keltner Channel LE) strategy to 20 (period look-back for the ATR) and 2 (value of the ATR).
I'm getting back into strategy testing – I've been inspired in the past by the work of Dr. Steenbarger, particularly with respect to his research on the intraday TICK. He used Excel mostly, not TradeStation.
Also, I used the Optimization function in TradeStation for the “sell N days later” which was the Time Stop Long Exit strategy in TradeStation. The Dollar Stop Loss I believe also is default. Simply run an optimize function in the “format strategy” tab with respect to the value of the stop loss and/or the days to hold a trade (I suggest running them separately).
Corey, interesting article, and it supports what I see when testing systems with a positive expectancy. Most people use stops which are too tight at the start and too wide (too big a trail) at the end. As a general rule for system optimization I plot maximum favorable excursion as a histogram. I can work out what the “sweet spot” for when the odds of holding a trade are no longer betting odds. As a general rule I should be thinking of getting out of a trade when the odds of continuation drop below 1:1. In practical terms this means that most system builders need to run either different stops for when they are slightly in profit or a lot in profit, or run a number of different stops simultaneously, for example a 1R chandelier stop run simultaneously with a bollinger bandwidth stop with a time based stop with a PAR stop. In my current production systems I run very loose stops until my trade achieves 4R (where R is the unit of risk, the distance from the entry to the initial stop) and then tighten stops up considerably. For some trend following systems the sweet spot is above 20R
Some other things to consider:
– the time to move stop to breakeven has a dramatic effect on performance
– most people optimize for maximum return, which is, in general a mistake. You should instead be optimizing for the standard deviation of trades (or more specifically the ratio of expectancy to standard deviation). This impacts the position size that you can take without incurring risk of ruin.
– it is unacceptable to trade without stops because at any time you cannot quantify the risk you are taking, so you cannot work out what is an acceptable position size accurately. To compensate for this lack of knowledge about what is a big position/small position, you must, by necessity take a smaller position size than is optimal. Assuming you have a legit positive expectancy system over time this is going to kill your returns.