Divergences, Fibonacci, and Structure in Gold Nov 10
Gold fell sharply from the $1,800 resistance level, so let’s take a look at what led up to the fall and what the current structural levels to watch are for gold, including a Fibonacci Cluster near $1,730.
First, the Hourly Structure:
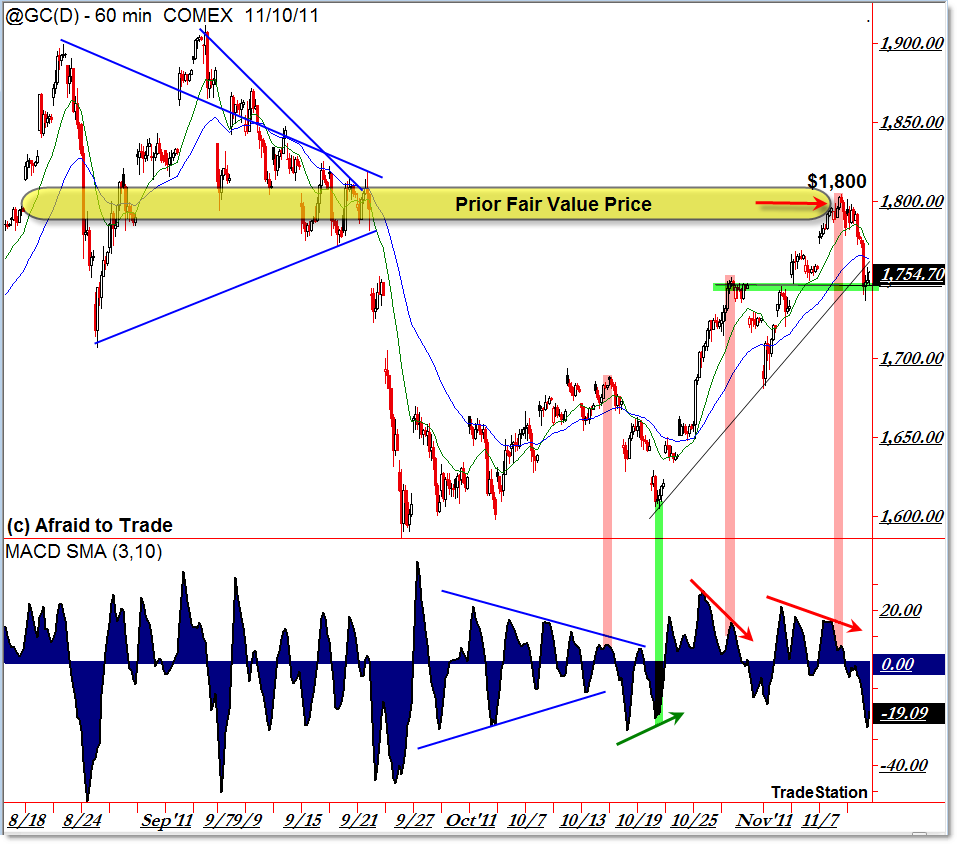
First, Gold’s Hourly (intraday) structure is in a confirmed UP-Trend as evidenced by the sequence of higher swing highs and lows – that’s the first place you start when analyzing price structure.
Second – of immediate interest – Gold has a tiny ‘polarity price’ near $1,750 which is where we are at the moment. It will be very important to see if gold can maintain the upward structure and thus rally higher off $1,750. If not, we’ll see lower potential support targets on the 15-min chart.
Third, price reversed/retraced into the “Fair Value Area” at $1,800 which was the Consolidation Point (apex) of the prior triangle trendline pattern in September. This is a good example of how price can turn-around at prior “Fair Value” (consolidation) areas.
And finally, I’m showing the 3/10 Momentum Oscillator with recent positive and negative divergences highlighted, and you can see the subsequent price reaction AFTER these divergences.
Main idea – the negative divergence into the $1,800 “Fair Value” area was enough to turn price lower, heading towards lower support targets at the moment.
Speaking of lower support targets, let’s drop to the 15-min chart to see the short-term Fibonacci areas to watch:
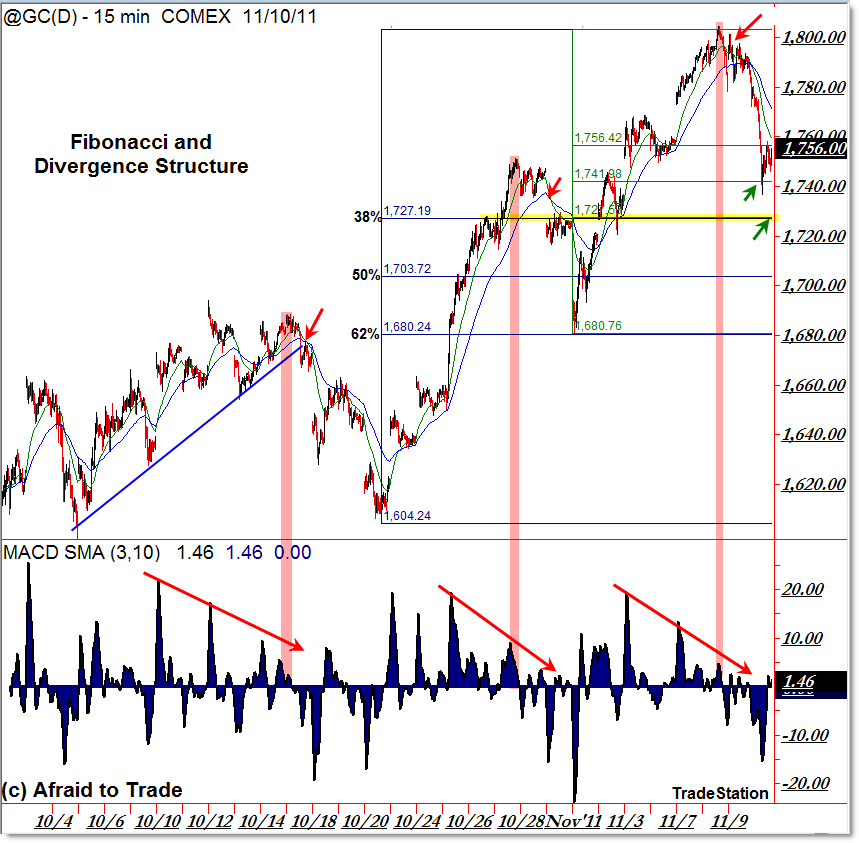
I like including lower timeframes so you can see the structure – namely divergences – clearer.
Take a moment to study the three big (multi-swing) negative momentum divergences that preceded short-term retracements (these are good spots to take profits off the table if you’re a short-term trader).
I drew two recent Fibonacci Grids, starting with the mid-October low and early November low.
These grids overlap at $1,727 or roughly the $1,730 level for easy reference. Otherwise, the closest short-term level is $1,742.
Though not shown on the intraday charts, the rising 20 day EMA rests at $1,730 as well so we’ll keep our attention focused on the $1,730 confluence to see if price holds and bounces off this level (confirming the bullish intraday structure) or else breaks through it on its way to $1,700 (which would be an unexpected set-back for the buyers/bulls).
Take a few moments to study these good examples of divergences and price retracements/resolutions on the intraday frame.
Corey Rosenbloom, CMT
Afraid to Trade.com
Follow Corey on Twitter: http://twitter.com/afraidtotrade
Corey’s new book The Complete Trading Course (Wiley Finance) is now available!


you must be an billionaire….its so easy . thx for sharing.but a little bit earlier would be better…
Hello Corey, I`ve been trying replicate your charts on http://www.stockcharts.com and I haven´t been able to set up the MACD SMA (3,10) Oscilator. Is it possible to do it in there? If not, where else can I do that?
Thanks!