Double Bear Flag and Strange Rally Intraday
What a day Thursday’s trading was! It seemed all hope was lost for the bulls until the last hour. Let’s dig a little deeper to see some patterns you might have overlooked, including a rare fractal (double) Bear Flag and a “Three Push” Pattern.
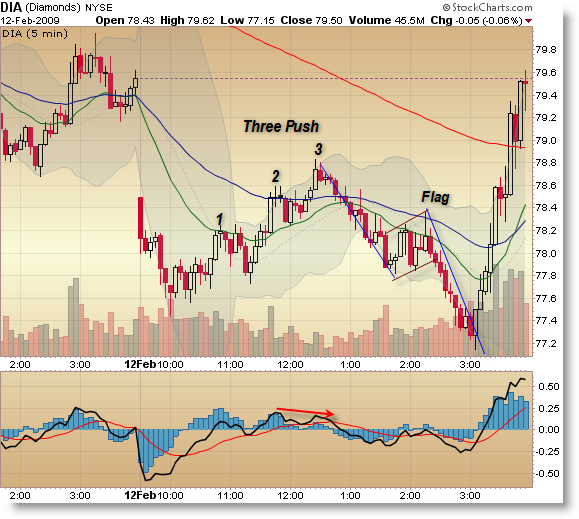
DIA 5-min chart:
Again, what a day. Thanks to the end-of-day announcement of the bank plan news, the market soared to the upside, catching the sellers off guard. You can’t predict announcements using any form of analysis – that’s why you use stops and money management… so you don’t lose too much if you’re caught in the downdraft on the wrong side of the market when they occur. Hey, if everything was so easy, everyone would be doing it!
Let’s focus on the repetitive patterns (that allow you to trade them with edge) that set-up in the day’s structure – there was an extremely rare pattern I wanted to highlight for you.
First, the day started with a downside gap and a break through support on the S&P 500, setting up an expected miserable day for the buyers and potential for a strong trend day down.
Price proceeded lower into a new momentum low, and then price formed an upward sloping retracement (correction) that was bound – with one exception – by rising parallel trend channels. It formed the “Three Push” Reversal Pattern I’ve been discussing lately, and indeed the third push (on a negative momentum divergence) ended the correction and price then fell to new lows on the day.
Unfortunately, price took out most stop-losses for those playing for a trend day as it breached the 50 EMA.
Price then formed an initial down-thrust, formed another parallel channel retracement (notice the “ABC” … A up, B down, C up) that formed a more comfortable and recognizable Bear Flag that ended right at the falling 50 EMA (allowing entry there for a great risk-reward). The target was a measured move of the prior impulse.
But wait – was there a higher power at work? I pointed this out mid-day to a couple of people when I noticed we might be forming a massive bear flag (it looks more evident on the 15-min chart).
Let’s focus now on the larger-scale bear flag, and identify the smaller fractal bear flag that formed the “Measured Move” side of the pattern.
DIA Focus on the Dual Bear Flags:
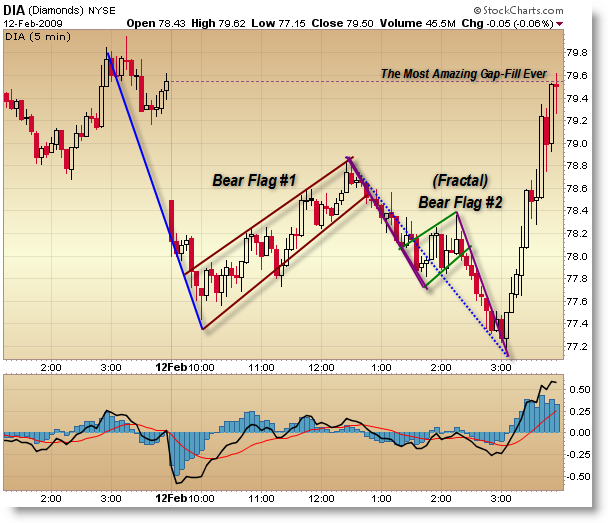
Again, take the time to see this pattern on the 15-minute chart for more clarity.
What’s important from a technical standpoint is that the lows on the day formed on the Measured Move (projection) of TWO Bear Flags. Technically, it also formed on a positive momentum divergence, but I tend to ignore indicators on trend days (this technically was not a trend day in the end).
So price found a bottom, and buyers flooded the market (with shorts covering) as more news came to light about the Mortgage Subsidies Plan. No technical analysis could have forecast the magnitude of the move – all traders are captive to sudden news/price shocks at any time.
Look deeper into the intraday structure for more clues, and overlay some Fibonacci grids over the price action here for some interesting insights as well. I only have so much room to discuss all the developments intraday.
Corey Rosenbloom
Afraid to Trade.com
Keep up-to-date with the Afraid to Trade Feed.
Follow Afraid to Trade on Twitter: http://twitter.com/afraidtotrade
the pattern I see in the middle is Head and Shoulders with correct left&right shoulders, head, and measured impulse down with correct length exactly from the neckline
I was playing for a trend day in my paper trades. The gap was over $1 so I didn’t consider fading it and when prices hit the 20ema at 11:00 I was thinking if we broke down off it we’d have a trend day. I went short around 11:15 as it looked as though we had a rejection at the 20ema. Sadly it didn’t work out and my paper trade was stopped out an hour later, incurring a loss of about 50-60 Dow points. But I made those points back on the bear flag trade in the afternoon.
Missed the 3-push pattern, thanks for pointing it out. Normally when I see higher highs I automatically think bullish so I don’t normally notice them until after the fact, if at all.
Corey, Thanks for pointing out the afternoon up move as an amazing gap fill. It was, indeed, amazing because the gap was so huge.
Of course, the afternoon rally started at exactly 3:00 pm, immediately after the mortgage subsidy rumor at 2:59 pm.
The rally was purely a short covering rally caused by confusion of the rumor and an initial upward shock against the strong downward trend that had accelerated after the breakdown of a major support level at 810.
The timing of the rumor after a breakdown indicates government intervention in order to arrest the plunge. PPT in action?
This obvious intervention by the government is turning the market into casino that people will soon fear to enter.
For tomorrow, as the market often reverses after a gap fill, should we expect the market to resume the downward trend in spite of the rumor triggered, gap filling hiccup??
moves of this magnitude are easily explained by the daily chart of SP
ie false break below 3 month trend line …… creating new sellers …. who ran into range support at the bollinger band
anyone who put on a new short yesterday am must have known the risks
the most amazing gap fill. love that!! nice post. fun day, hmmmm.
Today was a great example of a Plunge Protection Team (PPT) trading day. This article will explain who they are, how they operate, and how you can profit.
How to Trade a PPT Day
http://www.gamingthemarket.com/2009/02/how-to-trade-a-ppt-day.html
Anon,
Good call! I missed that. It’s a downward sloping H&S but you’re right – target to the upside achieved.
That’s why I review these end-of-day intraday charts – to be able to spot as many patterns as possible, study them, memorize them, then trade them more effectively/confidently as they appear in real time.
Dave,
I had a similar experience – in expecting a trend day that sort of came, sort of didn’t, then was eroded at the end.
The Three Push is a unique pattern – I guess it’s similar to a 5-wave terminal Elliott Wave impulse (where the 5th wave is the top and not a reason to get bullish).
The more we see these patterns, the better we’ll be!
NotAfraid,
I could have called it “The Impossible Gap Fill” or “The Little/Big Gap Fill that Could” or something like that. Officially, in my stats I run, today’s action WILL go down as a gap fill (in Excel) but in reality, there was absolutely no way possible to trade it possible (entering in the morning) without taking a stop-loss.
PPT perhaps. It’s just so weird. We had a daily breakout to the downside, drawing in many short-sellers (which was a proper entry) but the news smacked them and drove prices higher, back above the breakdown zone (and taking stop-losses with it).
Ultimately, it’s an argument why trading isn’t easy, why patterns are never 100%, and why we should use a stop-loss on every trade and utilize good money mgt (don’t risk it all one one trade).
At any time, this can happen, especially trading short.
BOTD,
It was an interesting day. Strange how the big surge came off the terminal projection of two bear flags, but still couldn’t have forecast the magnitude. I’m not even sure we can call it a gap-fill but in reality it did.
This kind of stuff is what keeps trading fun.
GTM,
Great article! Thanks for sharing.
Reggie,
Precisely. We’ve recently had bull traps, and it – I guess – should come as no surprise that we have bear traps as well.
We’re in the middle of a large, consolidation triangle and both sides are getting whipped around.
Might be best to wait until we break before trying to play this area on the dailies. It’s tough.
i was shock over viewing the afternoons trade.many traders were not expecting on it. the good thing about trading after the negative things happened there might be a better thing that would come-out.