Downtrending TEVA Surprise Gaps to New Lows
Pharma stock TEVA gives us another reason why we should NOT fight trends in motion.
It also reminds us why we adopted our core strategy principle at Afraid to Trade:
“Weak stocks tend to get weaker; Strong stocks tend to get stronger.”
Let’s see what just happened with the big gap down and why it wasn’t really a surprise:
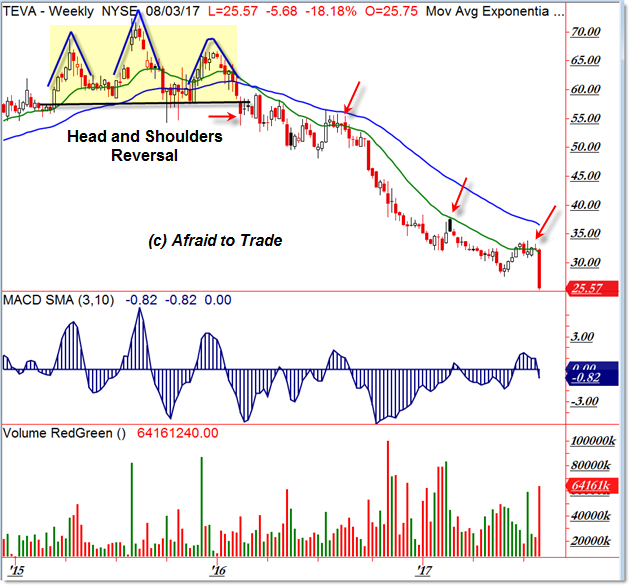
On the Weekly timeframe, TEVA topped at the $70.00 per share level in 2015 amid a full-year Head and Shoulders Reversal Pattern (a stellar example).
With the early 2016 breakdown beneath the $60.00 per share neckline accompanied with a new momentum low (and bearish volume spike), the stage was set for a reversal into a bearish downtrend.
Since early 2016, that bearish downtrend has continued relentlessly with minor retracements.
In other words, TEVA turned weak with a breakdown and kept getting weaker.
My red arrows highlight at least three valid pullbacks/retracements on the weekly chart, all of which were valid short-sell (pro-trend) successful opportunities.
With the bigger picture – a persistent downtrend – in mind, let’s shift to today’s gap-down crash:
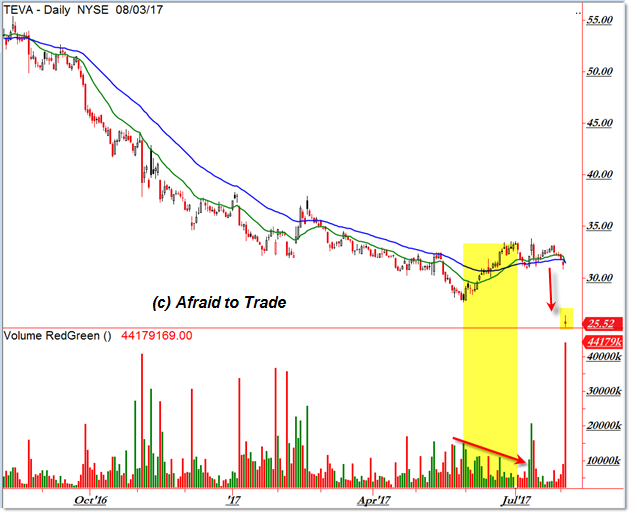
This is the simplified Daily Chart of TEVA as the downtrend occurred over the last year.
Volume surged at the beginning of 2017 but look closely to see that it was BEARISH volume.
This was a sign of confirmation and forecast likely lower prices yet to come (volume confirmed price).
The downtrend stabalized and price formed a possible “Rounded Reversal” or floor of support near $30.00 per share.
It looked like buyers were gaining the upper hand in forcing a trend reversal… until you look at volume.
Look closely at the June 2017 volume on the rally (yellow highlight).
Bullish buy volume (green) started strong but declined (diverged) as the rally continued.
This is a non-confirmation – a divergence – and volume suggests the rally is weak.
Ultimately price stalled just shy of $35.00 per share.
A bullish reversal would have taken place on a breakout above $35.00… but that didn’t happen.
The message from volume (divergence) forecast likely lower prices to come, as did the Weekly Chart Downtrend two-years in the making.
Here we are, August 3 with a one-day collapse from above $30.00 toward $25.00 per share.
This weak stock deceived traders into believing it was reversing.
It wasn’t. The weak stock got weaker.
Don’t fight or fade trends in motion.

Follow along with members of the Afraid to Trade Premium Membership for real-time updates and additional trade planning.
Corey Rosenbloom, CMT
Follow Corey on Twitter: http://twitter.com/afraidtotrade
Corey’s book The Complete Trading Course (Wiley Finance) is now available along with the newly released Profiting from the Life Cycle of a Stock Trend presentation (also from Wiley).”