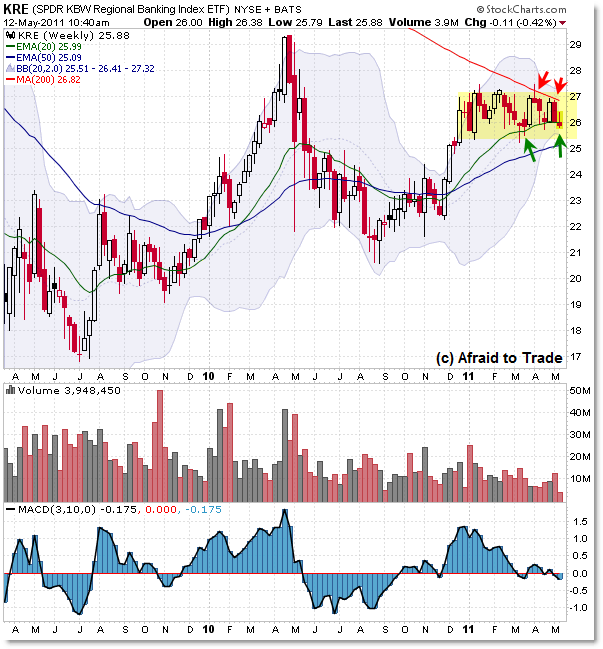
Dual Compression Example in KRE Regional Banks ETF
While scanning major ETFs, I found an interesting pattern/structure that I wanted to share on the Regional Banking ETF – KRE.
The Regional Banking ETF can be a good proxy for smaller/community banks as opposed to the large financial institutions like Bank of America, Citigroup, JP Morgan, etc.
So what’s going on and what should we be watching? Let’s start with the Weekly Chart:

Here’s what I found interesting.
The ETF is showing a structure I like to call “EMA Compression,” wherein price is literally sandwiched or trapped between major moving averages, and is bouncing between them.
In this case, the falling 200 week SMA provides the upper ceiling of resistance while the rising 20 week EMA provides the rising floor.
These boundaries are simply $27.00 and $26.00 per share respectively.
The implication is that this structure cannot continue indefinitely, and thus price must break through one of these averages, which could ignite a breakout move or otherwise range expansion situation.
In other words, a firm breakthrough above $27 could allow for a breakout to the $29 area, just as a breakdown under $26 instantly targets the 50w EMA at $25 then lower to the prior range contraction (“value area”) from $23 to $24.
The benefit of using larger ETFs for larger “IF/THEN” logic like this is that you can drill-down and select leading or lagging stocks in the sector/ETF to play for a larger chance of profit (a $1.00 move isn’t very appealing). Stocks within the ETF that show the same pattern would thus be trading candidates.
Otherwise, you can use the ETF as a proxy for what is happening in the broader Retail Banking industry – a breakout would be a good sign while a breakdown would not.
While we don’t see moving average compression in the daily chart, we do see a clean horizontal contraction and range boundaries:

This time, we see a clearer horizontal range structure with boundaries existing at $27.00 and $25.50. There were little ‘pokes’ outside this “Value Area” which were rejected as price came back into the region.
The Central Value Area is thus $26.25, which is roughly the midpoint of the structure (and where the 20 and 50 day EMAs have converged).
You can also see that ETF volume has contracted steadily during this range period, which is typical during pauses in trends (traders tend to look for opportunities elsewhere).
Anyway, I wanted to highlight these developments and areas to watch. Contractions tend to lead to Range Breakout Expansions, and thus changes in market structure.
Corey Rosenbloom, CMT
Afraid to Trade.com
Follow Corey on Twitter: http://twitter.com/afraidtotrade
Corey’s new book The Complete Trading Course (Wiley Finance) is now available!

Excellent and brilliant post. treatment for eczema ! hand eczema ! how to treat eczema
The graphical representation of these banks looks good, but I am a bit confused seeing it.
bankruptcy lawyers in Douglasville