Dual Trendline Cross May Spell Trouble for Crude Oil
I highlighted a dual trendline cross this weekend in Crude Oil, and so far we are seeing the downside action suggested by this big bump into overhead resistance.
Let’s look at the daily and then intraday charts of Crude Oil to see the combining of two trendlines, and a new – important – price level to watch for clues.
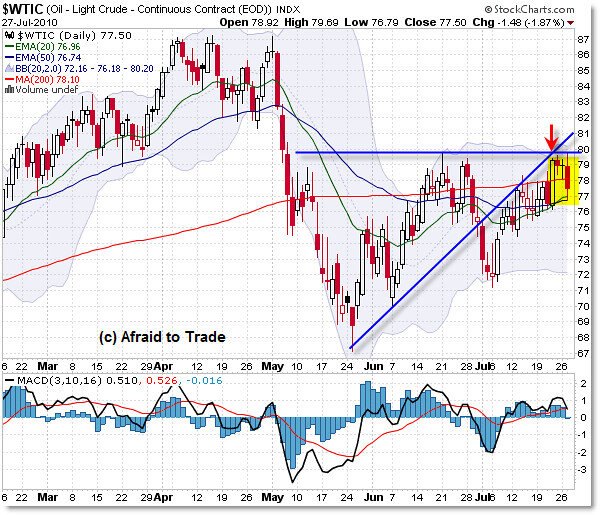
First, the Daily Chart of $WTIC Crude Oil Index:

Without getting into too much detail, I wanted to call your attention to the dual trendline cross at the $79.50 level as highlighted by the red arrow.
The horizontal line represents short-term overhead resistance at the $80 index level, and then the rising line represents the “Polarity Principle” of price, in that how the same price trendline can be used both as support (on the way up) and resistance (on the way down).
The other main point to watch is the dual EMA convergence at the $77 index level – so far, it’s holding as support.
So, one of the two HAS to break – oil can remain between $77 and $80 forever. Either the dual trendlines will break or the dual moving averages will break.
As traders, we have to be prepared for either outcome, though it sure seems like price ‘wants’ to break to the downside.
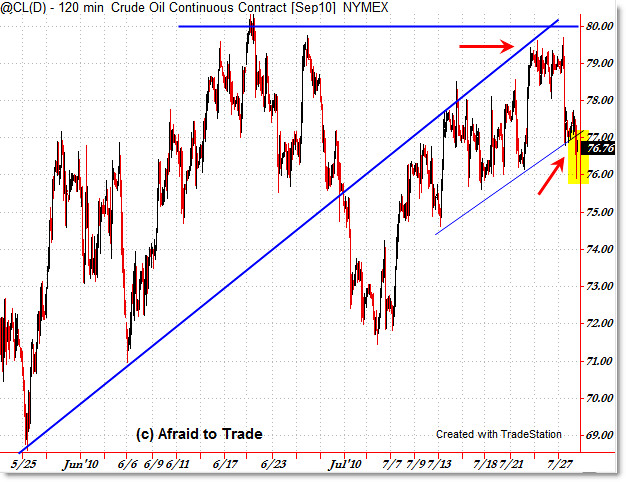
Let’s now zoom inside the intraday chart for a ‘price purism’ look at the trendlines:

Viewing TradeStation’s @CL crude oil continuous futures contract, we can peek inside the formation of these daily chart trendlines.
Price hit a brick wall at the $79.50 area and this week is turning down sharply – right on cue.
I’m showing a very short-term rising trendline that ends at the $77.00 level – and price broke under that level today. As of this writing, price tested the $76.00 level but then recovered into noon CST back to $77.00, so this will be the short-term defining line for traders to watch.
Back above $77 and we could see a vicious bear trap, but as long as price remains under $77, the chart seems to indicate lower prices ahead.
Keep up each week with detailed analysis not just on crude oil, but the five major markets (stocks, bonds, gold, oil, and the Dollar Index) by becoming a member of the Weekly Inter-market reports.
Watch $77 very carefully for clues to a trap, which would send price higher as shorts rush to cover (“Popped Stops”) which would imply a positive breakout for stocks, or alternatively if the chart signal carries forward, be on guard for possible lower crude oil prices, which would likely correspond with lower stock prices.
Corey Rosenbloom, CMT
Afraid to Trade.com
Follow Corey on Twitter: http://twitter.com/afraidtotrade

Bear Trapping $77+ Popped Stops… here we come!
Corey,
It's the first time I've seen someone talking of the Dual Trendline cross on the web… I've known that for years…
Steoli
(http://tradingthecow.blogspot.com/)
Corey, What do you make after today morning's action on Crude oil? Is that bullish?
But what happens after it breaks out?
Like any failed pattern, we would anticipate a breakout above $80 triggered initially by short-sellers stopping out/short squeeze, along with buyers buying the breakout.
Like MadScientist said in the comments, an upside push is likely to squeeze out the shorts, causing them to buy to cover. To the extent the bears hit the panic buy (cover) button, we'll go higher if price busts the resistance.