Essential April Fibonacci Retracement Levels for Dow NASDAQ and SPX
With the US Equity Markets correcting lower against recent highs, let’s take a moment to update our short-term Fibonacci Retracement Reference levels and note something very interesting about how far the NASDAQ has fallen.
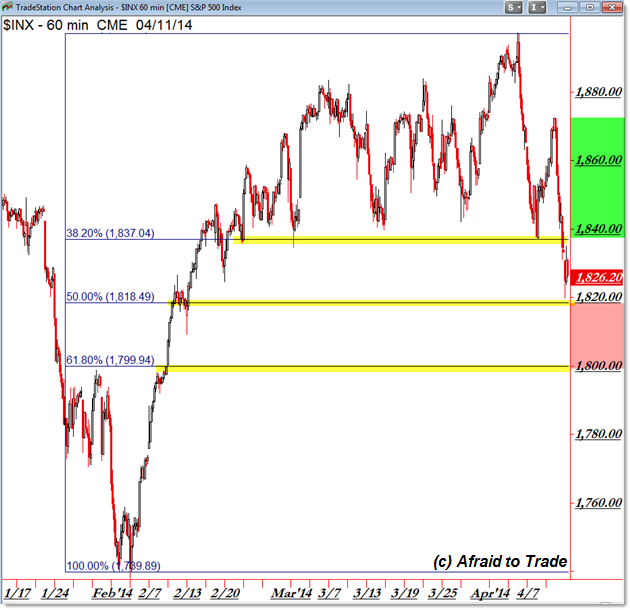
We’ll start with the S&P 500 levels:

The S&P 500 is stair-stepping lower, starting with the 38.2% Fibonacci Retracement level which formed the lower bound of the recent rectangle pattern.
The recent breakdown under the 1,840 (1,837) reference level led immediately to a successful test of the midpoint or 50% level into 1,820. Note the current intraday rally back to the underside of the 1,837 level.
The next short-sell trigger will be a breakdown event under 1,818.50 (target 1,800). Keep these levels in mind.
Next, the levels in the Dow Jones Industrial Average are similar (in structure):

With the pattern similar to the S&P 500, we’ll focus on the 16,145 level (38.2%) along with the current 16,000 confluence.
A failure or breakdown under 16,000 opens a quick sell-off (open air) pathway toward 15,850.
The most interesting chart – in comparison – is the NASDAQ Index:

We can use Fibonacci Retracement Levels to compare similar markets (or ETFs).
For example, while the S&P 500 and Dow Jones break the 38.2% and challenge the 50% or “midpoint” Fibonacci levels, the NASDAQ has already shattered the 61.8% level and almost retraced a full 100% to the prior low carved out in February.
Namely, we’ll be focusing on the “round number” 4,000 level.
Note how price has already stair-stepped each of the three main Fibonacci Levels (4,221, 4,175, then 4,130).
Bookmark this page and keep these reference levels handy when planning intraday or swing trades.
Follow along with members of the Daily Commentary and Idealized Trades summaries for real-time updates and additional trade planning.
Corey Rosenbloom, CMT
Afraid to Trade.com
Follow Corey on Twitter: http://twitter.com/afraidtotrade
Corey’s new book The Complete Trading Course (Wiley Finance) is now available along with the newly released Profiting from the Life Cycle of a Stock Trend presentation (also from Wiley).


One Comment
Comments are closed.