Extreme Divergence and Rounded Reversal in USO US Oil
I wanted to highlight the possibility for a trend reversal or at least low-risk opportunity in the US Oil Fund (USO), or at a minimum, show a large-scale structure potentially playing itself out.
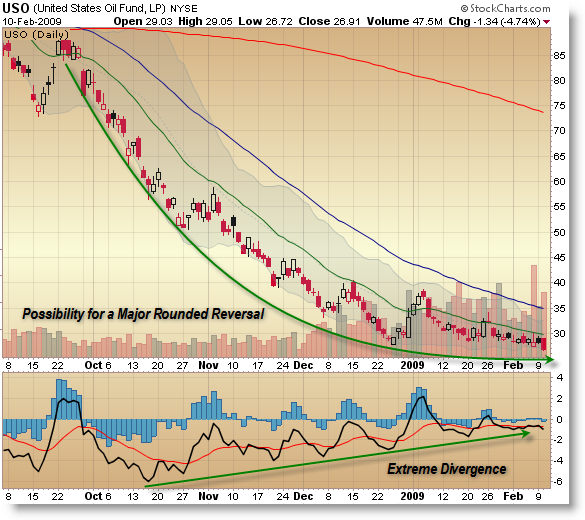
USO Daily:
Before reading, keep in mind that there’s no guarantee this pattern will produce the expected result, but it’s worth a casual glance at a minimum.
First, notice the price forming a Rounded Arc (I call it “Rounded Reversal”) from the September swing down to current prices. Keep in mind that we made a new low (actually an all-time low) on Tuesday, so by no means is there no risk in this position.
Second, notice how the 3/10 momentum oscillator has formed seven positive divergences as price continued to make new lows – that’s extreme.
I see one of two possibilities:
1. We are indeed forming a true “Rounded Reversal” and the oscillator is hinting at growing positive momentum and we’ll see a reversal to the upside very soon
2. The momentum oscillator is giving a false signal, similar to that on extreme trend days and so the indicator/signal must be ignored (like I always say, “Turn Off Indicators on Trend Days” or on major moves”)
It will be very interesting to see which scenario plays out and how to adjust expectations if needed. This is a huge structural development and it can have a major impact on the chart and of course how oil affects other markets IF we do get a reversal.
Finally, whether or not Oil reverses, it is a good idea to take into account this structure (so you can trade it when it sets up on other stocks/markets) because it is a very low-risk opportunity.
Why is it low risk?
If you enter long right here, you would be able to place a stop very close to price (perhaps two or so percent beneath your entry) but would be able to play for a very large target if you’re able to capture in close to the bottom IF a reversal takes place. Depending on your stop-loss (and if price reverses), you might have a large multiple reward to your initial risk (perhaps 10 to 1 or greater). This is more of a swing or position trade than a scalp trade.
Do your own analysis and make your own decision, but over time, you’ll do well to find trading opportunities that offer low risk but high reward… even if you’re ‘right’ on 50% of your trades.
Corey Rosenbloom
Afraid to Trade.com
Keep up-to-date with the Afraid to Trade Feed.
Follow Afraid to Trade on Twitter: http://twitter.com/afraidtotrade
I’ve been going with the no oscillators on trend days strategy here. Except this isn’t a trend day, maybe it’s trend year? 😉
I see price continually being rejected at the 20ema, so even though the rate of decline is slowing we’re still in a strong trend.
Dave,
Right – I’ve traded so many trend days but rarely come up a timeframe to trade daily charts anymore but it looks similar so I’m pointing it out to see what readers think and if the anti-trend day policy (intraday) also works on daily charts.
Should be an interesting real-time experiment we all can follow!
going to agree with Dave. trend down so the Macd is insignificant
United States Oil Fund LP (USO:xase:AMEX)
Competitors: XOM:xnys:NYSE Add Competitor
Follow Instrument
Technical Insight™
Add Alert
Event Details for: Descending Continuation Triangle Rate this Event: (0 ratings)
A Descending Continuation Triangle is considered a bearish signal, indicating that the current downtrend may continue. The pattern illustrates lows occurring at a constant price level, with highs moving constantly lower. The Technical Event® occurs when the price breaks out of the triangle formation to close below the lower trendline, thereby confirming the pattern. More…
Event Date: 10 Feb 2009
Opportunity Type: Short-Term Bearish
Close Price: $26.91
Target Price Range: $20.75 – $22.00
Price Period: Daily
Volume: 47,391,170
Pattern Duration: 15 days
Inbound Trend Duration: 31 days
Research the effects of Contango on this fund before making investment decions.
I draw the opposite conclusion from your graph.
The MACD has been “diverging” from price every day since last October.
In strong trends, pretty much all indicators become worthless. RSI, Stochastic, MACD. Only thing that works is the moving averages.
Just a lesson to learn in run-away trends.
David,
I had a conversation with a trader in Orlando who said just that – regarding contango. That the USO actually suffers from contract roll-overs and gets whacked with negative effects. Seems the DXO (Double Long Crude) would be affected worse.