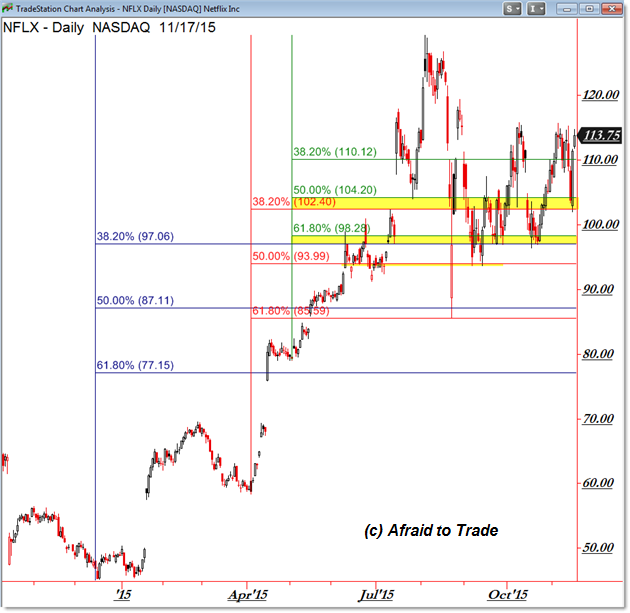
Fibonacci Key Pivot Level Planning Chart for Netflix NFLX
If you’re trading Netflix (NFLX) as a swing or intraday trader, be sure to reference this short-term Fibonacci Retracement Level grid for the stock.
Here’s the Daily Chart with key Fibonacci Levels highlighted:

Our quick retracement grid above shows the 2015 to present price action and three Fibonacci Retracement grids drawn from swing lows to the August swing high near $130.00 per share.
While you can reference each individual Fibonacci Retracement as drawn, often the more important information comes from the confluence or overlap of Fibonacci Retracements.
In this example, we have two Fibonacci Zones which include the following:
- $94.00 and $98.00 per share (lower confluence)
- $102.40 and $104.20 (mid-confluence)
Price is currently rebounding strongly off the mid-level confluence above $102.00 per share.
Beyond the Fibonacci Retracement Grid above, note the $115.00 per share horizontal resistance level.
If price clears this resistance barrier, look to trade another bullish breakout toward new highs near $130.00.
Otherwise, failure (resistance) here suggests a play back to $110.00 then the mid-level overlap again near $104.00.
No matter what other strategies you’re using to trade Netflix, use this as a simple reference (planning) chart.
Follow along with members of the Afraid to Trade Premium Membership for real-time updates and additional trade planning.
Corey Rosenbloom, CMT
Afraid to Trade.com
Follow Corey on Twitter: http://twitter.com/afraidtotrade
Corey’s book The Complete Trading Course (Wiley Finance) is now available along with the newly released Profiting from the Life Cycle of a Stock Trend presentation (also from Wiley).


One Comment
Comments are closed.