Focusing on the Key Trading Level for Copper JJC
Copper has entered a key trading decision point – namely confluence resistance – and I wanted to highlight this area along with the objective trade planning levels at this inflection level.
Let’s start with a broader perspective of the current level and trend structure (JJC as an ETF proxy):

For the JJC commodity ETF, we can see a persistent (primary) Downtrend in motion since the 2011 top (which was actually ahead of oil, gold, silver, and the peak of other commodity markets).
The main idea for short-term traders is that price is “compressed” between the falling 50 week EMA and (slightly) rising 20 week EMA at the $41.13 and $40.31 price levels respectively.
We’ll focus our attention on the $41.00 level which forms a confluence with the falling 50 week EMA, upper Bollinger Band, and shorter-term Fibonacci Retracement Levels.
Here’s a wider perspective of the Daily Chart structure (and Fibonacci) of @HG Copper Futures:

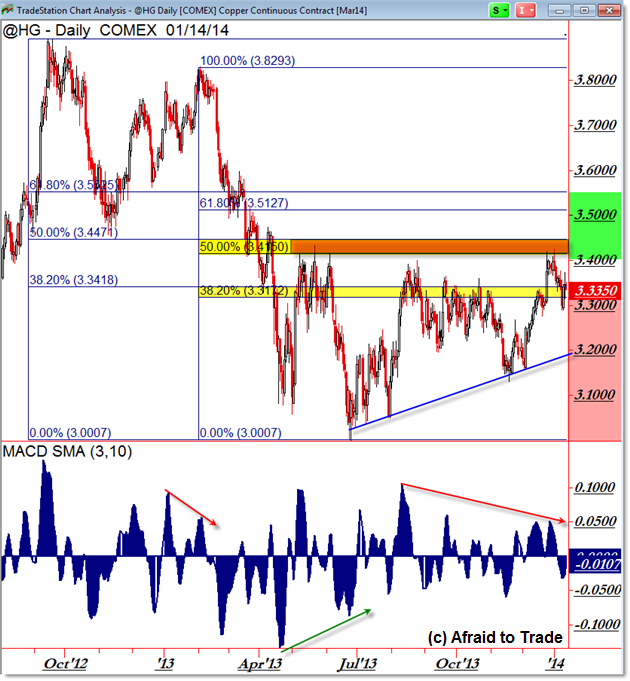
For the actual commodity, our focal point is the $3.42 (roughly $3.41) level as shown by the 23.6% Retracement and price confluence.
We also note the negative momentum divergence into this key resistance area.
A logical downward inflection targets the $3.200 level (rising trendline) or lower while an “alternate thesis” upside breakout sets in motion a short-squeeze upward impulse that could quickly target the $3.70 level.
We can see the trading parameters clearer on a zoomed-in perspective of the Daily Chart:

I drew a Confluence Fibonacci Retracement Grid (short-term) which shows overlap just above the $3.40 level.
Not only is this a Fibonacci Level, it’s also a “polarity” price level which means this region has served both as prior support and resistance – it makes it a key reference point.
We can also see the negative momentum divergence clearer on the zoomed-in chart (note prior divergences and price reactions).
Short-term traders can play for additional downside action away from $3.400 (particularly on a trigger-break under $3.300).
On the other hand, a real-time breakout above the red Fibonacci Cluster above suggests that a breakout impulse could take price back above the $3.500 level.
Use these key inflection points and short-term targets for entries, management, and stop-loss planning relative to the $3.4100 level.
Follow along with members of the Daily Commentary and Idealized Trades summaries for real-time updates and additional trade planning parameters as we watch a “hold and bounce” or “break and retrace” scenario play out in the near future.
Corey Rosenbloom, CMT
Afraid to Trade.com
Follow Corey on Twitter: http://twitter.com/afraidtotrade
Corey’s new book The Complete Trading Course (Wiley Finance) is now available along with the newly released Profiting from the Life Cycle of a Stock Trend presentation (also from Wiley).

