Gap Fade Stats for January 09
The start of February means it’s time to examine the raw statistics on the monthly “Gap Fade” numbers in the DIA (Dow Jones ETF). Remember, we consider a ‘gap’ to be at least $0.25 in the DIA and define a ‘gap fill’ as an opening greater than $0.25 up or down when the price equals yesterday’s close at ANY point in the day. Stop-losses are not factored in – you’ll need to develop your own strategy for that.
Let’s see the gap fading chart for January 2009:
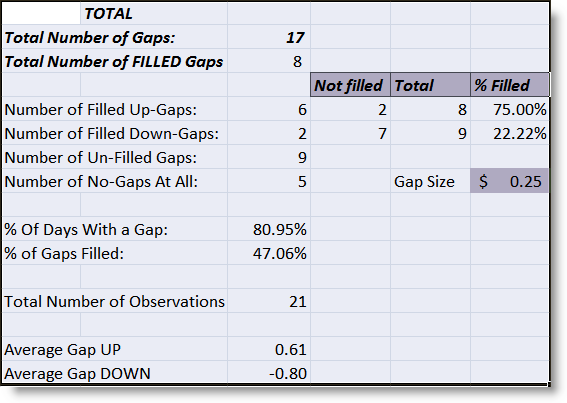
Of the 21 trading days in January, 17 days produced a gap at least $0.25 in the DIA. Of these 17, 8 gaps were filled intraday, which gives us a sub-50% statistic at 47.06%. For 2008, every month but August produced a gap-fill percentage greater than 50% (or random chance).
If you look closer, the failure gaps came to the downside. This means that if the market gapped down, it was less likely (22%) to fill downside gaps (by rising higher on the day) than it was to fill upside gaps (by trading lower on the day). This makes sense as January saw the market shave 10% off most of the major US Equity Indexes. It was quite a weak month.
There were 8 upside gaps and 6 of these filled (with price going lower on the day), giving us a 75% fill rate.
There were 9 downside gaps and only 2 of these filled (rising on the day) producing a 22% fill rate.
January was more in line with expectations (in terms of gap volatility) as the average up-gap was $0.61 while the average down-gap was $0.80.
By the way, if we increase our criteria of “gap” to include all gaps greater than $1.00, we would see that there were 8 gaps greater than a DIA $1.00, and of these, only 3 filled, which gave us a paltry 37.50% fill-rate. This is in line with the assumption that it’s generally not best to fade DIA gaps greater than $1.00.
For a look-back at all of 2008, follow the links on my previous “Gap Stats for December 2008” post.
Stay tuned for the statistics for all of 2008!