Gold Teeters on Support Line
Gold prices are at a key support level, where just a slight push either way will lead to a breakout move. The daily moving averages and a key trendline hold the current price in the balance. Let’s look at Gold’s daily structure.
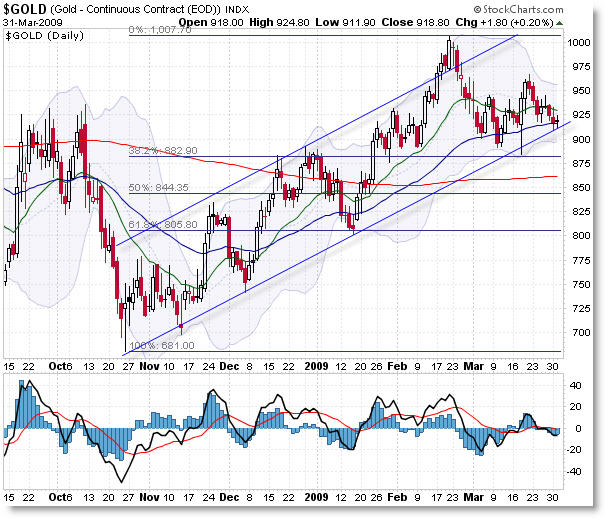
A rising trend channel has developed off the October 2008 lows which carries to this day. Gold had false breakout of the trend channel in late February when it tested the $1,000 per ounce level (and subsequently failed), and now we’re hovering precariously at key support about the $900 level.
The bottom of the trend channel happens to be supporting price carefully, as a doji (often known as a reversal pattern) has formed at the recent test of the trend line. In addition, price is balanced just above the rising 50 day exponential moving average, which should further be expected to hold support.
Throw in the fact that $900 is a key ‘psychological’ support number which has held ever since price broke above it in January and we have the makings of a potential ‘confluence support’ level underneath price right now.
That’s not to say gold is guaranteed to hold above $900, but as of right now, the odds (and price structure, which is clearly in an uptrend) seem to favor support holding these levels.
I have drawn a Fibonacci retracement grid as well off the October lows to give some guidance should price fail at $900.
It’s worth watching gold closely, for if price supports here, odds would strongly favor a run-up to at least the $1,000 level again. However, a break beneath $900 (particularly beneath $850) could set-up a quick test of the $700 level again, so either way, price cannot stay at the $900 level forever.
With the US Dollar coming into the daily Cradle (sell), and Gold prices at confluence support, we have a distinct inflection point coming for both markets. This should be interesting.
Corey Rosenbloom
Afraid to Trade.com
Follow Corey on Twitter: http://twitter.com/afraidtotrade
Travel to the LA Trader’s Expo in June to hear Corey speak on “Idealized Trades for Intraday Traders”
it appears gold is about to make a cradle that would be bearish. thus invalidating the US dollar cradle…. hopefully by end of week we will know where their going.
Looking at that chart and all the overlap sure says correction rather than impulse wave up. More importantly, looking at the long term chart going back to 1999 makes me wonder, is gold tracing out a regular flat wave 4 from the 2007 wave 3 top with one more trip down to the 700 area in a C wave required before blastoff in wave 5 to new all-time highs?
Anon,
Gold has some work to do (to the downside) before forming a Cradle (EMA crossover). The last Cradle was December 08 which held for a decent rally.
We’d need Gold to break support and then the cradle if formed would be an even stronger (higher) probability short-sell.
It’s not there yet but it will be interesting to see if it forms.
Andrew,
Yes, that’s the only thing holding unbridled bullishness back – overlap and consolidation all the way up.
I have competing counts on the long-term structure, namely was the 2008 move a 5 or a 3? I lean to the “it was a 3” interpretation (noting that W4 pulled back to key Fibonacci and EMA support) but we could indeed be in the corrective phase after a 5.
Crude Oil is approaching a test of the 50% retracement of the Feb/March rally as well.
Scott,
That and Crude Oil itself is coming back into the Cradle Support.
With all these markets balanced at key support/resistance levels, we could get a big inflection move off these zones that could continue. It’s so funny how these cross-markets continue to confirm each other’s movements.
Corey-
I guess the problem I see with gold is that I like using MACD to look for trends, and MACD has been dead for the past weeks; the ADX is low as well. This isn’t really the environment for a big move, as I look at it. But if we all looked at it the same way this wouldn’t be any fun, would it?
haha Like I say to clients – if this were so easy, we’d all be Billionaires!
But it comes down to odds, probability, edge, and structure. And we do the best we can do and manage risk accordingly.
All the discussions and differing opinion is exactly what keeps us so engaged and interested!
Hello Corey, one quick question. what do you guys mean by “overlap”?
Dominick in a normal impulse the wave 2 and 4 corrections of the same degree do not trade in the same price areas. If you look at the Dow Jones chart posted Wednesday you will see that. The gold chart however shows the two big counter trend moves in the uptrend with a lot of overlap and that means either a correction or a leading/ending diagonal.
Thankyou Andrew.