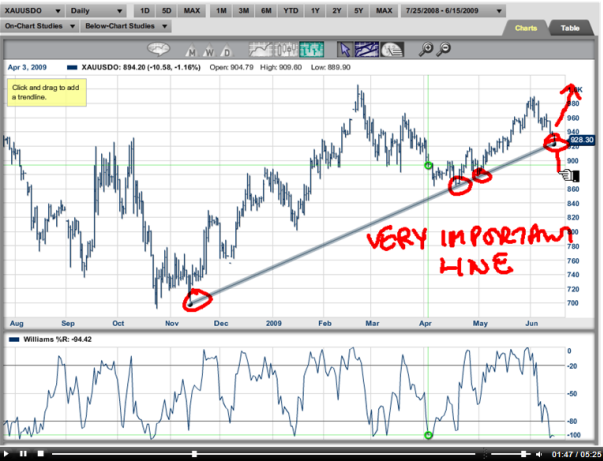
Gold Update Video – Will Long Term Trendline Stop the Fall?
Adam Hewison released another timely update on the gold market this morning entitled “Gold Update – Will a Long-Term Trendline Stop the Hemorrhaging?”
In a short (free) five-minute video (no registration required), Adam discusses a long term trendline (shown above), Fibonacci, sentiment, trade triangles, and Williams %R – which is quite a task in a short video!
I have to admit that in my analysis of gold, I missed seeing the trendline which is why it’s always good to have another perspective and get as much data as you can.
Adam notes that we have a four-times touched trendline that originates from the November lows, and price has currently pulled back to this level which also reflects a Fibonacci retracement and an oversold reading in the Williams %R Oscillator.
The trend is still up, but gold buyers are going to have to defend this technical (chart) level to head higher, and Adam shows key levels price might be drawn towards if we break beneath critical support at $920.
Without giving any more away, head over and watch Adam’s video analysis update on the gold market – thanks as always to Adam and staff for making these videos available to us.
Corey Rosenbloom, CMT


The luster of gold… a safe haven and a desirable place to park money… With government spending ballooning, the value of the US dollar in retreat and the strong possibility of future inflation, one would intuitively expect gold to be the commodity of choice. But, it's not a good idea to trade based on soley on intuition.
The trendline defined in Adam's web video is certainly of critical importance to a future bull rally in gold. A long entry at this moment in time is RISKY and requires great care. Using tight stops would be a good idea, but price has momentarily violate trend lines and support in the past, so one can't place stops too tight.
This morning price dropped and tested a key level $928, and held. This level is really, really important! It marks several prior price tops which also align with the trend line; it should offer solid support. If price holds here, which is still very uncertain, one might expect to see a retest of the highs.
Corey, could you offer some expertise and perspective on where we are in the EW count? I think we are in the third wave up of a larger EW expansion… the fractal wave count of leg three appears to be in two down.
gold's headed to 720 as the next long term stopping point..
jmo
Well ADAM didn't told the whole story.
I saw th trendline last week and also the MACD divergence. Yes sir check it out !
We have a divergence and lets see if it confirms!