Harley Davidson HOG Builds Power Rally off Support
We’re seeing a number of stocks build similar patterns but I wanted to highlight Harley Davidson as a great example of a stock building a base ahead of a rally on positive divergences.
Let’s note the example and then plan possible targets now that buyers have revved up this stock from support.
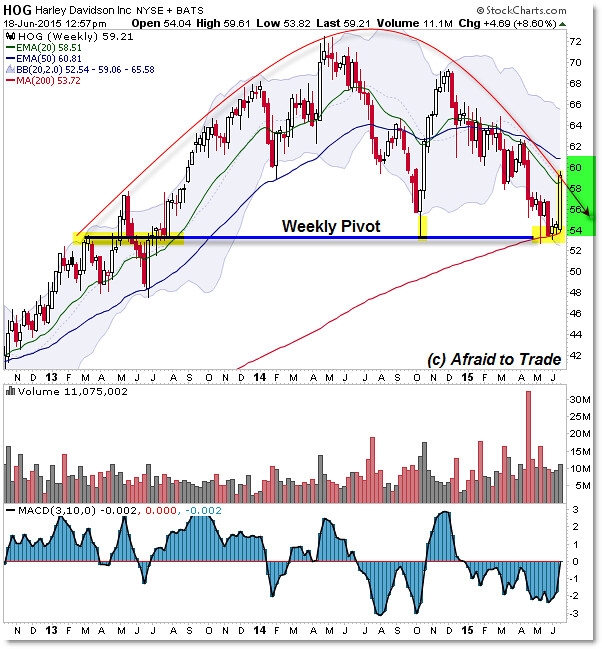
Here’s the Weekly Chart which sets the stage for this week’s bullish reversal:

One of my favorite “Two-Step” Trade Setups is the
“Higher Timeframe Support with Lower Timeframe Divergence”
Mainly, we’re focusing attention on a higher timeframe key pivot point – in this case the $53.00 per share level which was a weekly pivot as highlighted and the rising 200 week Simple Moving Average.
HOG formed a couple small reversal-style candles into this level which added to the inflection point.
Shares have traded in an “Arc Trendline” distribution pattern since 2013 – we’re now trading up into the target of the falling ‘arc’ trendline and weekly moving averages into the $60.00 per share level.
For now, focus your attention (for this example) on the support pivot at $53.00 per share.
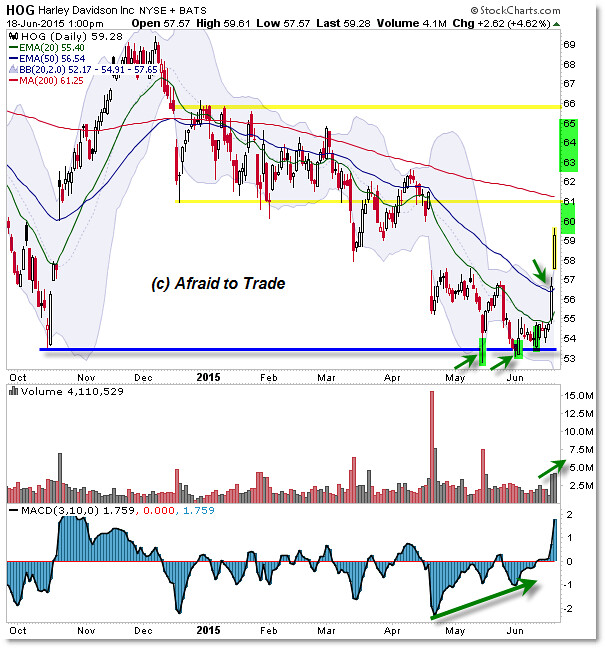
Now, let’s turn to the Daily Chart and see what momentum suggested about this pivot support line:

Price power-reversed off the $53.00 per share level in October 2014 and we were seeing another retest (touch) of this key pivot price level.
As buyers and sellers battled to hold – or break – the $53.00 level, a positive momentum divergence developed on the Daily Chart.
Here we see additional reversal candles forming into this support level – one more piece of bullish evidence.
Wednesday’s and now today’s session resulted in a powerful reversal up away from support toward the targets into $60.00 per share – well ahead of schedule.
For reference, aggressive traders had a spot to enter into the touch of $53.00 – with a stop beneath this level.
If you don’t want to play INTO support, let price “prove itself” to you with an initial rally.
In this case, price breaking the short-term price resistance and 20 day EMA just under $55.00 per share was the trigger-entry or catalyst to a breakout.
Divergences are like a spring that is coiling and building up energy. When the spring – or energy – is released, price can snap-back and reverse quickly.
For traders, this is an aggressive reversal-style strategy that is higher risk than retracement (flag) trades, but it certainly has its place in a growing trader’s toolbox.
Harley (HOG) give us a great real-world example of this concept and set-up – and now outcome.
Follow along with members of the Afraid to Trade Premium Membership for real-time updates and additional trade planning.
Corey Rosenbloom, CMT
Afraid to Trade.com
Follow Corey on Twitter: http://twitter.com/afraidtotrade
Corey’s book The Complete Trading Course (Wiley Finance) is now available along with the newly released Profiting from the Life Cycle of a Stock Trend presentation (also from Wiley).


If we want to succeed then we should be careful with using these support levels, it could work well, but we need to think deep before going in just like that, it definitely will bring trouble. It’s crucial to analysis perfectly in order to take any benefits from it. For me it’s easier when you got 11 times award winning broker like OctaFX, it’s having cTrader platform where I can analysis well and that gives me really big chance to make profits!
It is always big risk trading on Stock without proper plans,
I always love to trade with Support/Resistance way, but even for this we need
to be good in money management, it’s the only way we could ever get positive
results. Right now I am trading on cTrader platform with OctaFX broker; it is
such an incredible platform having advance charts including 10-20-30 minutes
and almost every timeframe, so that obviously makes it so good for anyone to
trade with.