Head and Shoulders Now Forms on SP500 with Rising Wedge Break
That’s a lot to say in one headline! In addition to a (so far) confirmed downside break of the bearish rising wedge on the S&P 500, an ominous Head and Shoulders pattern has now formed on the 60 minute structure. Let’s take a look at this new development.
If there ever was a confluence sell signal, this is it. Does it guarantee price will go down? No, but let’s look at what just happened.
On Monday, we saw a strong momentum move down off the upper trendline of the bearish rising wedge which I had been discussing previously. Not only did we gap down off that level, but we officially broke out of the rising channel at that time. That was an intermediate-term sell signal (to play for a price expansion move down).
Price has risen to re-test the lower trend channel (which offered an even better short-sell signal, as price often re-tests the breakout point before plunging lower) and today we are seeing a continuation of the inflection down off that level (at roughly 860).
That alone is a powerful signal with a low risk (stop either above 870 or 880, depending on your risk tolerance) and high profit target (a test of the 750 level or perhaps as low as the 666 March low, though that would be an aggressive target).
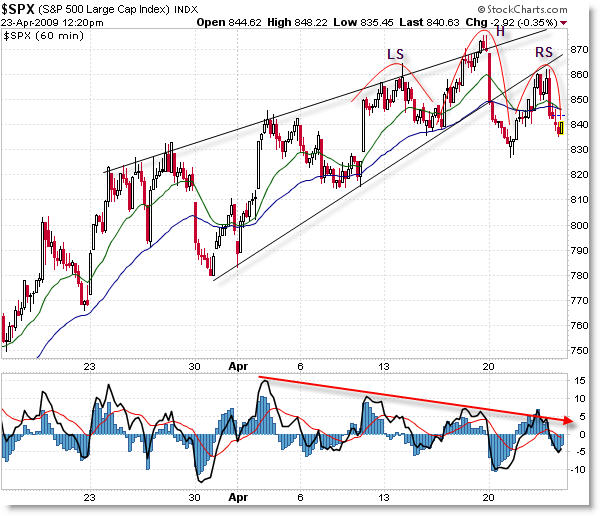
On top of the bearish wedge breakdown, a possible Head and Shoulders (reversal) pattern has formed on the most recent price swings. Look closely to see the left shoulder, head, and right shoulder in pure form. The Right Shoulder formed on the re-test of the rising lower trendline.
The neckline now rests at around 830, and a break of that level would set-up a price projection move down to the 780 level (the projection is taken from the Head to the Neckline – roughly 45 points – and then subtracted from the neckline at 830).
Adding to the fray, we have a lengthy negative momentum divergence that has set-in (also known as the “Three Push” reversal pattern). In addition, a Cradle Sell trade just formed on the hourlies (note the 20 EMA crossing under the 50 EMA).
If bulls (buyers) manage to invalidate these ominous chart patterns – which is a possibility – it would go directly against the odds and historical significance of these patterns.
Corey Rosenbloom, CMT
Afraid to Trade.com
Follow Corey on Twitter: http://twitter.com/afraidtotrade
Travel to the LA Trader’s Expo in June to hear Corey speak on “Idealized Trades for Intraday Traders”
Looks for me Corey. Didn’t see that. Thanks.
Thanks for the insight Corey! Your posts are consistently informative.
Corey, Is there a chance that you can post your time [in addition to the date that you already do] of your post. With the stupid whipsawing in the market everyday, it is getting hard to know the timing of a specific data point on the indices. Thank you.
Hi Corey, thanks for sharing your analysis. I was also watching for a developping H&S, but now it looks more a bearish diamond formation.
Anon & Karl,
Thanks – I’m trying to do at least one intraday post around noon that describes a pertinent structure/opportunity for the day.
Anon,
I’ll try to remember to do so – what’s good about StockCharts is that they freeze the time (15 minute delay though) when you capture one of their intraday charts. For example, I captured this chart at 12:20pm EST.
I’m also trying to post quick snapshots to my Twitter followers with just a chart and a comment – I don’t want to write a whole blog post to show what I’m seeing when it develops quickly.
MT,
Diamond. Hmm. Those are quite rare – thanks for pointing it out. Very interesting.
And yet another push in the final 20 minutes of trading challenges the Bears and continues the case for the Bulls. A lot of EWT followers have been waiting for this Diagonal to end, but in doing so they have really felt “handcuffed” and have been unable to capitalize on this huge bid in the market and bull move of the past 7 weeks.
Probably time for a correction, but this move has nonetheless been WAY MORE powerful than most have thought.
Good Luck Trading!
Haha it just leaves you scratching your head.
It’s not just Elliott people, it’s those who follow classic TA patterns – like the Head & Shoulders (here), Rising Wedge, Rounded Reversal, etc.
But any form of analysis gives you probabilities, never certainties and in the end price (supply and demand) rules the day. That’s why we don’t load up our entire account on a position and toss the dice on our analysis – risk control/position sizing is the key to long-term success.
Drawing a trendline from the head to the right shoulder might give you a good short entry point if price touches the trendline, which it looks like it probably will tomorrow.
Tom,
Good call! I’ll try to post that either here or via Twitter pics.
Corey,
I actually sent out a 2 hour chart yesterday where I pointed out a possible head and shoulder. (I will email it) I am trying to get the proper time frame down for my analysis versus trading horizon. Unfornatley, I am not able to day trade (the 9 to 5 and capital req)but try to play a 2-4 day developments. These are quite challenging due to the time it takes to develop. I have trading some credit spreads as the time works in my favor.
Also, had some questions about the CMT. (email)
Congrats on your designation.
Corey,
I originally thought that too, but I’m more side with MT, it looks more like a dimond rather then H&S… But either way, I think bull might have a chance to pop all these bearish formation and kill all bears… reason being, A PERFECT H&S need volume confirmation, where the left shoulder have the biggest volume and then volume lower as it build the head and the right shoulder should have the least amount of volume… But looking at the volume, it does not confirm H&S pattern… so I guess rather then all these bearish formation (bearish rising wedge, H&S, Dimond top), maybe is just a simple sideway consolidation before another pop up… (fu.. I hate bulls, they should all get their head chopped)
Although, after the pop we may be a head fake out and then all the bull really get their head chopped… haha
Anyhow, maybe people (including TA) are fairly bullish now because we’ve spent too much time below 200SMA and now they are doing a “reversion to mean” trade. So yes, is possible that spx can go back to 900s or even 1000s, just a tade above the 200SMA and get all bulls excited and then…. CHOP CHOP CHOP… off with their heads…
The odds definitely favor downside here… we’ve got the bearish rising wedge, momentum divergences, h&s top, and what appears to be a lower high put in this week.
But the bulls have been getting beat up for the past 18 months. For 18 months buying dips has been the wrong thing to do. So maybe it’s time for that to change. If the bears can’t break the cradle and make a lower low here then a lot of people will be left scratching their heads.
For the record I am short. But I’m not expecting new lows now, just a deep retracement and a resumption of the uptrend. If we take out the highs around SPX 860 I will hedge my shorts, if we take out 875 I will exit my shorts completely. I choose to hedge because this market has been whipping everyone around lately and I don’t want to get taken out of my positions on a false break.
Corey, can you consider and explain how the current charts are just a “simple sideways consolidation” and when a break upward might occur? What differentiates it? Does it match the current situation? What target? It just seems like the bulls are going to make this go higher … to the 200 MA … so when? And what resistence upward would exist? With everyone looking for lower targets … what would be upper targets?
Don-Da-Mon, well, for your info, this H&S has become a pennant and yes like you said, it might pop up, since pennnt is continuation pattern…
People looking for a head and shoulders pattern are simply deluding themselves given the fact that even if it occurs, the “neckline” is so far away from here that it renders such a view as absurdly untradeable.