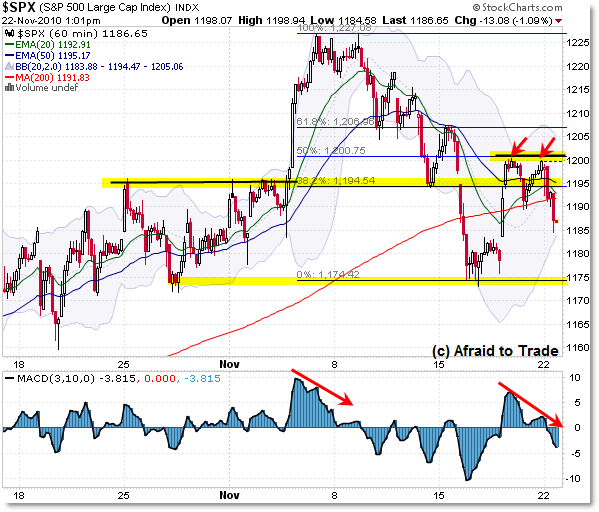
Holiday SPX Short Term Key Levels to Watch
With Monday’s decline taking some investors and traders by surprise, let’s pull the perspective back and take a look at the current Daily Chart and then Hourly Chart structure, levels to watch, and “IF/THEN” Logic setting up right now.
First, the Daily S&P 500:

Stripping the chart to its most basic simplicity, there are two key price levels to watch.
Immediately overhead, we have the 1,200 which held this morning as resistance – and this big failure (so far) here could be telling. As such, keep a close eye on 1,200.
ANY resurgence in price above 1,200 triggers a “Popped Stops” play to 1,230 – simple expectation (especially now, since bears are rushing in and placing fresh stops above 1,200).
So that’s resistance, but what’s support?
Initially, we have the rising 50d EMA at 1,171 and then the lower Bollinger Band at 1,167. Perhaps more importantly, price formed a short-term swing low last week at 1,174.
Take a look at my prior “Playing EMA Breaks” lesson post for how trends and EMAs work in terms of setting quick plays and targets.
That forms a triple confluence about the 1,170 area to watch. And of course, IF price falls under 1,170, THEN expect lower prices – perhaps to 1,150 or lower.
Ok – so that may be as far as some you need to go in terms of setting up your expectations and potential trades for this holiday week.
Those that want a bit more information from the Hourly Chart, read on:

We see the initial resistance at the 1,195 level going into November and the massive 20 point “Popped Stops” play that was expected on a breakout above 1,200 – 1,228 was the likely upside target, being the 61.8% “Large Scale” Fibonacci area – which successfully held back the buyers.
Now that an initial downswing formed to test the 1,170 area, what’s the short-term levels to watch?
I drew a simple Fibonacci Retracement grid from the recent 1,228 high to the 1,174 low to arrive at the following levels to watch. In fact, only one level comes into play in a major way.
It’s the 50% Retracement at exactly 1,200. Not coincidence, but confluence – and so far the buyers have been unable to break the confluence.
Friday’s push up to the (now) “Double Top” (see lower timeframe charts) occurred on a clear negative momentum divergence that – at least from the chart odds – forecast better odds of a downward move than a breakthrough.
Today’s action is that downward fall from the 1,200 level.
The key short-term support level to watch again is the 1,174 level from the prior swing low – a price takedown here sets up even lower targets ahead.
And of course the alternate “IF/THEN” is in play, which is the “IF buyers can bust through all the resistance at 1,200, THEN the next play becomes a ‘Popped Stops’ move to 1,230.”
From the chart perspective, unless we get a solid break above 1,200 or under 1,170, we’re likely to see a ping-pong range move going into Thursday’s Thanksgiving Holiday.
Be safe and watch these levels objectively.
Corey Rosenbloom, CMT
Afraid to Trade.com
Follow Corey on Twitter: http://twitter.com/afraidtotrade

I think the uptrend over the last few days was a B wave, and that now there is a C-wave down, with 5-waves complete, now in a correction.
That's sort of the count I'm toying with as well. All good uptrends need at least a minor correction. If B ended today, then if C equals A then the downside target is about 1,155 or so which ends about where I drew the two horizontal lines from prior price levels. We'll see!
No, looks like it's just zig zagging or something…part of a wave 4?
If you think we're headed down to 1155 on Turkey week, you're fighting some powerful seasonals. The popped stops to 1230 play is more likely. And I say this as a bear.
I always try to keep an open mind and open “IF/THEN” analysis as it's helped me avoid bias as a trader which led to missed opportunities and frustration.
But you're right – we do have a bullish holiday seasonal as has frequently been the case (today's closing action was in line with that), so any move back above 1,200 forces short-term bears who got short today to capitulate, hitting the “buy to cover” button, which – when combined with any new buyers above 1,200 – could pop the market right back to 1,230 (or just under that level).
The pattern is much clearer now, and it looks like a B or 4th wave now.
The B wave probably.