Hourly Intermarket Grid Update to Start March
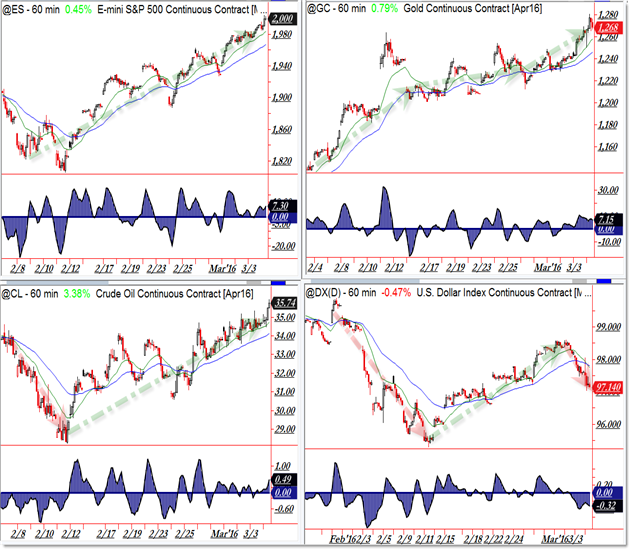
February was an exciting month as Oil and Stocks finally found a short-term bottom and rallied most of the month.
What’s the current trend and how are the “quad markets” moving right now?
Let’s update our Intermarket Grid:

Whether or not you trade all or any of these markets, it’s helpful to get a sense of Money Flow by viewing “Cross-Market” or Intermarket Grids, even as brief as these.
Early February saw stocks and oil reverse off $28.50 and 1,820 respectively as a strong rally took hold through the rest of the month.
Technically speaking, at this point these are “counter-trend” rallies against the higher timeframe downtrends.
Nevertheless, stocks achieved their upward goal into 2,000 as did Oil into $35.00.
In addition to the bullish “Risk-On” Money Flow for stocks and oil, gold joined the fray with a strong rally at the beginning of February (when stocks fell) and held above $1,200 to today.
Gold is spiking up toward $1,300 as a strong bullish impulse takes hold.
The Dollar similarly declined and reversed up (all around February 11) but traded lower through March.
It’s interesting to note the strong positive (short-term) correlation of the Dollar with Stocks and Oil lately – that correlation bent in March with the Dollar’s sell-off.
We always cover deeper analysis and plan both trading (swing and intraday) and even short-term investing strategies with these markets, along with US Treasuries.
We do it each weekend in the Intermarket Membership report. Join us and have a great start to each week!
Corey

