Insider Buying and Selling Charts
Are the ‘insiders’ buying or selling into this recent rally? Phil’s Stock World takes a look at what’s happening behind the scenes on the recent market rally – let’s take a look.
Per Phil’s article:
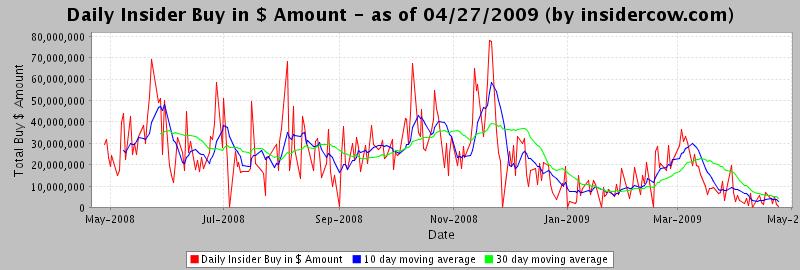
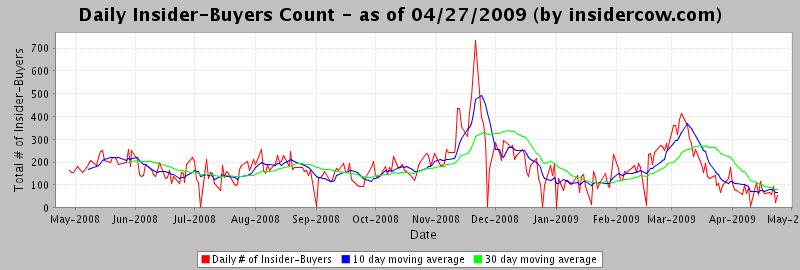
Take a look at the charts summarizing insider buying ($ amount and number of shares) during different periods and comparing insider buying and insider selling. You can see insider buying is at a low, whether measured in $ or numbers, and the ratio insider buying to insider selling is also at the lower end of its normal range.
Daily Insider Buying Dollars (Amount):
Number of Insiders Buying:
Daily Insider Buy/Sell Ratio:
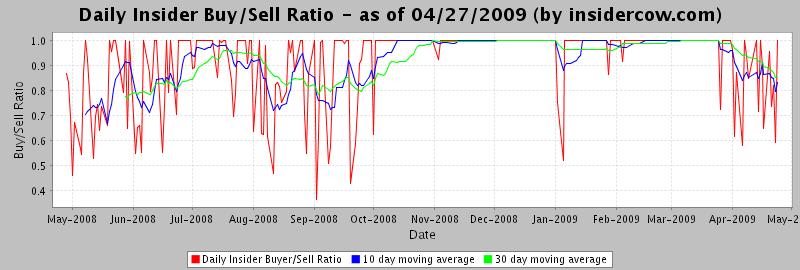
The take-away is that insiders are SELLING into this rally, rather than buying – which begs the question, “What is driving the market higher?”
On the S&P 500 daily chart, we have a volume divergence, breadth divergence, negative momentum divergence, trendline break (bearish), and break-out of a rising wedge – none of which is bullish or encouraging for investors. Mish’s describes these and more in his post “Technical Indicators Scream Caution.”
Phil’s Stock World provides frequent intraday news updates similar to this one to members. As part of a special opportunity, readers of the Afraid to Trade blog are offered a free subscription. Use referrer code “Corey” (which is included in the links here) and select the $49 per month option and – using my code – your $49 subscription will be free (monthly fee will be waived) and you will receive a 20% discount on premium services, should you find Phil’s Stock World to be a valuable resource. Click here to sign up.
I’ll be providing periodic links to Phil’s featured articles, which should add a bit more depth to the Afraid to Trade commentary by giving a news/fundamental/insider’s perspective beyond my focus on the charts and technical analysis.
Corey Rosenbloom, CMT
Afraid to Trade.com
if we sign up for Phil’s Stock World is every month free or just the recent one?
Anon,
I should have clarified – every month is free – it’s as if you subscribed for $49 per month but because of the promotional code, the subscription is free. I’ve been trying out the service this month and agreed to the promotion because the articles/updates have been timely and informative.
[This commentor has been banned for use of foul language and personal attacks in two separate comments]
Note: All IP addresses are logged when you make comments.
I think the free membership is a good way to check out the service to see what they have to offer. I’ve enjoyed the timeliness of the updates – what I’m discussing here is intraday updates, analysis, and commentaries. To my knowledge, the free membership does not grant you access to his portfolios or premium content.
Readers, feel free to share your experiences – positive or negative.
I’m very protective of what I promote so if the feedback is bad, I’ll stop the promotion immediately.
I appreciate your feedback – no personal attacks please to Phil or anyone.
Cory :
You mentioned that you are seeing “Breadth divergence” in S & P 500. Could you please explain this a bit more ?
Corey,
I was a member for a few months about a couple years ago. I saw no evidence of number fudging. Not saying it doesn’t exist; I just didn’t see it, and I did follow some of his trades.
Previous comment was from Win.
They always say to sell the rallys is a downtrend. Well technically we are in a downtrend, and technically this is a rally.