Intel INTC Impresses Us with a Breakout but Is it a Bull Trap?
Shares of Intel (INTC) broke above the falling 200 day average to generate a new buying opportunity!
But what else is the chart showing, especially the last time this same opportunity occurred… and failed.
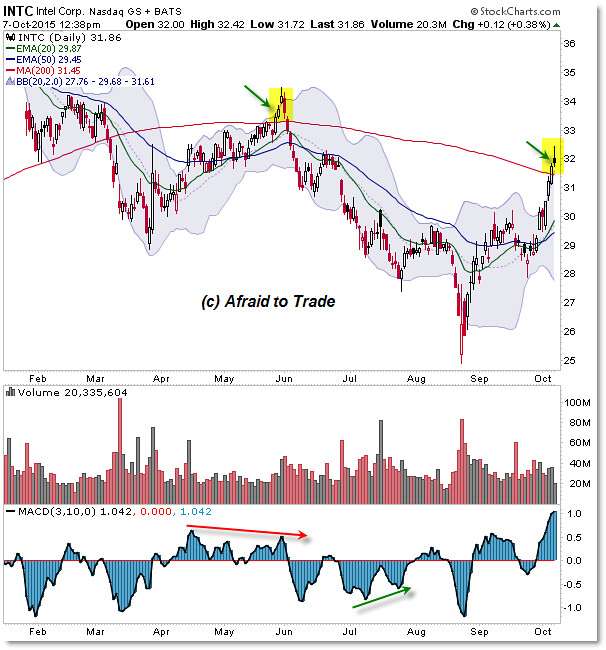
We’ll start with the Daily Chart for additional information and level planning:

First and foremost, let’s focus our attention on the right side of the chart which highlights the breakout.
Shares rallied from the spike low of $25.00 per share in August and have broken above the 20 and 50 day EMAs only to continue the bullish reversal (showing relative strength to the market) and break now above the falling 200 day SMA.
Usually, this is a bullish sign and it may very well be one right now… but price needs to hold these levels AND break through a weekly resistance trendline level before we get excited about shares here.
Now, let’s take a look at late May 2015 when the same thing occurred:
- A Spike Reversal off $29.00 per share;
- A break above the 20 and 50 day EMAs;
- and a Breakout above the 200 day SMA (red).
Shares held the gain for three closes above this level and then reversed back under it, failing to hold the gains ahead of a seven day sell-off that continued the broader downtrend.
Absolutely, this time may be different and shares could reverse the downtrend and break higher.
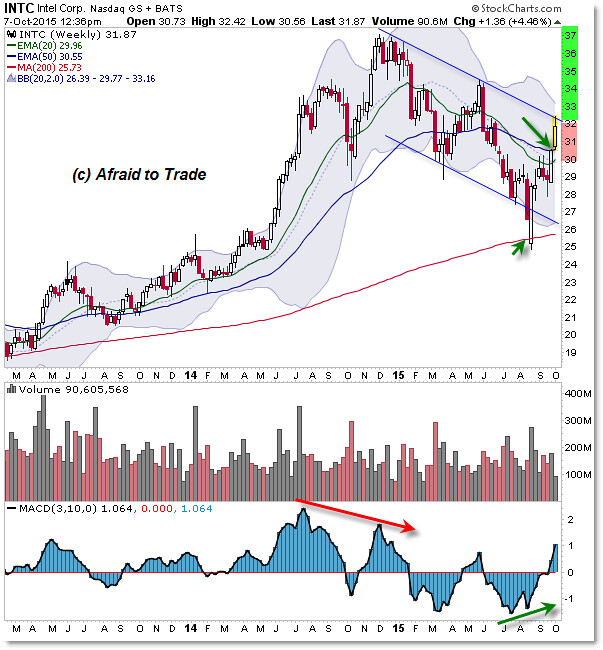
But before we jump in bullishly or bearishly today, let’s compare the Daily Chart to the Weekly Chart:

The most important factor to watch right now is the underside of the falling “Range” Trendline at $32.00.
Note how an orderly “Falling Parallel Trendline Channel” or just “Falling Upper Trendline” connects the highs of Intel (INTC) back to late 2014.
Share prices have traded orderly within this broader price pattern and now challenge the upper level.
Our expectations – and thus trading opportunities – will develop from what happens immediately at $32.
A surge breakout on higher volume suggests that the breakout is real and price will extend higher first toward $34.00 (the prior high) and then perhaps higher than $37.00 per share into the future.
Otherwise, if the trendline holds and price cannot break through the wall of overhead resistance, then a downside or “Short-Sell” Failure Outcome – like that of May 2015 – would give opportunities to bears to short-sell against resistance.
As you’re plotting and planning what to do next, focus on these levels and the immediate reaction “UP Away From” or “DOWN Away From” the $32.00 per share important Bull/Bear Pivot line.
Follow along with members of the Afraid to Trade Premium Membership for real-time updates and additional trade planning.
Corey Rosenbloom, CMT
Afraid to Trade.com
Follow Corey on Twitter: http://twitter.com/afraidtotrade
Corey’s book The Complete Trading Course (Wiley Finance) is now available along with the newly released Profiting from the Life Cycle of a Stock Trend presentation (also from Wiley).

We have to be careful with these things, as Forex is very unpredictable, so it’s not necessary that things will work out same way, it might go different direction. We need to be careful of that. I am always careful of things, as I am also getting huge cash back up to 50%; it really helps me a lot and allows me the room to be free and aggressive while even if things go wrong, I get supported with this service, it is powered by OctaFX broker.