Interesting Rounded Reversal on FXI China Weekly
Headlines have featured on China and its pulling back of its economic stimulus, which has contributed in part not only to a pullback in FXI (iShares Xinhua China 25 ETF).
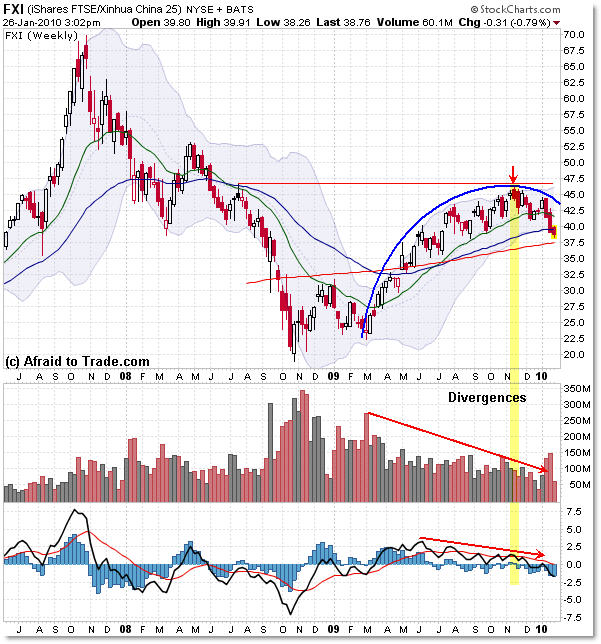
Let’s take a quick look at the FXI weekly chart to see a lesson in lengthy negative divergences and a likely developing “Rounded Reversal” pattern forming into a critical support level.

FXI bottomed in October 2008 and then rallied into resistance at the $30 level, and formed a higher low than the US Equity Markets when they bottomed officially in March 2009.
From there, the ETF has doubled in price from $22 to the November 2009 high just above $45 per share… but it did so on an ever decreasing posture in volume and momentum (3/10 Oscillator shown).
Lengthy non-confirmations often forecast price reversals, and that could be exactly what’s forming now, especially since price has taken on a “Rounded Reversal” shape (a price pattern associated with reversals).
However, there is a key level to watch to determine whether this will be all the pullback we get… or whether a true trend reversal is favored over a simple pullback retracement.
The level is $37.50, which marks the weekly “Line in the Sand” between simple pullback swing in an uptrend… or trend reversal.
That’s because the 200 week moving average currently rests just shy of $37.50, which is just one indicator to watch.
What gives this level more importance is that the 38.2% Fibonacci retracement from the March 2009 lows to the November high (not shown) also rests at $37.50 ($37.40 to be exact).
If we draw the larger Fibonacci grid from the October 2008 low, then the 38.2% retracement rests at $36.10.
Thus, we could assume that if sellers continue pushing price lower, particularly through the confluence $37.50 level, then the next likely stop would be the $36.00 level, and any move under $36.00 would strongly shift the odds that price is likely to continue lower.
For now, investors and traders should watch what happens at the $37.50 level – whether it is deemed a ‘buying opportunity’ and forms a support level, or whether sellers can muscle their way through the confluence support zone on a pathway to lower prices.
Corey Rosenbloom, CMT
Afraid to Trade.com
Follow Corey on Twitter: http://twitter.com/afraidtotrade

FXI long-term pattern outlook ~
FXI long-term pattern outlook ~