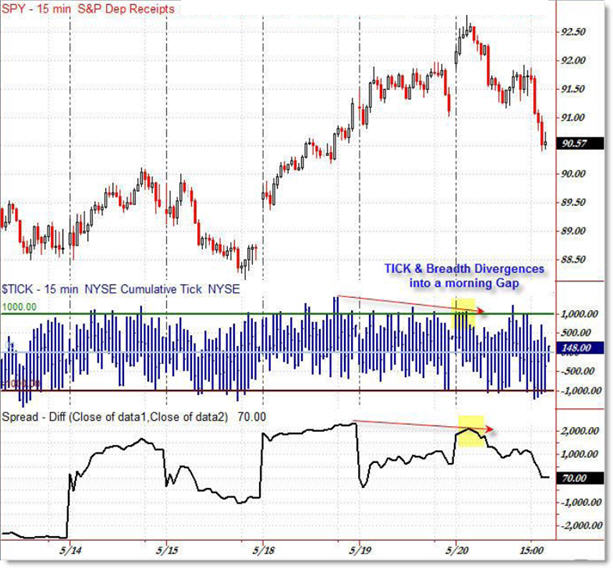
Internal Divergences Fail to Confirm Morning Gap
I wanted to highlight a key structural point that many traders might have missed when evaluating this morning’s gap in the stock market. Let’s learn a quick lesson on market internals as sources of confirmation.

What we’re looking at is the SPY (S&P 500 ETF) on a 15-minute chart with the NYSE TICK in the middle panel and the “Breadth” or net difference between the Advancers and Decliners on the lower panel. These help serve as market internals to allow us to look ‘under the hood’ to see if the internals are ‘confirming’ the new price highs.
In this case, they clearly were not, but many traders failed to see this when they took a look at price by itself.
The highest TICK high – almost 1,500 – formed mid-Monday (May 18th) which preceded the price highs yet to come. Once the market gapped up on Wednesday, we had a maximum TICK reading of 1,030, which was a bit lower than the prior high when the SPY traded at $90.80. We would expect new price highs to be ‘confirmed’ by new TICK highs to continue to be bullish.
We see the same picture in the “Breadth.” At the peak at the close Monday, we had a differential of 2,730 more stocks trading higher on the day, though when we opened on Wednesday, the Breadth managed to climb just above 2,500 on the peak, which was up from the 2,300 we saw at the open – another ‘non-confirmation.’
Ultimately, the day formed a “Failed Trend Day Up” which actually led to a type of Trend Day in the opposite direction – down. Looking back, it formed a beautiful bear flag on the 15-minute frame.
As the market opens particularly to a new high (or low), look ‘inside’ the market to the internals to see if these are also confirming the market strength… or whispering an opposite story that is only heard by those who know how to listen.
Corey Rosenbloom, CMT
Afraid to Trade.com
Subscribe to the RSS Feed here.
Follow Corey on Twitter: http://twitter.com/afraidtotrade

Corey,
Would you consider today's SPY tape on the 5-min chart to have formed a “Three Push” pattern? Where the 12:00, 12:35, 1:00 bars (on closing basis Eastern Time) formed the “Three Pushes” on the 3/10 indicator?
Just curious what you perceive.
Thanks,
-todd
I'll toss in an observation to add to Todd's… consider the spread-diff graph compared to price; The uptrend in price began at the reversal low on 5/15/09. Note the s-d lows from that point on, and draw a trend line thru those low points, a supporting trendline… Now view the upper bound in the same way. You can use the divergence arrow Corey drew… A consolidating wedge is evident; and, a break in that trendline finally occurs after a consolidating bear flag appears in the price chart. A break in the pattern occurs at about 3:00 PM, 5/20/09.
It's interesting to see such patterns form outside the price charts.
This is very informative. You managed to include good points!
Is it possible that between the last 2 days that a head & shoulders reversal between 92.80 and 91.00 is forming? If so would the target down to the gap at roughly 89.25 be valid?
yep, same divergence confirmed by 3/10osc., rsi14, mfi14 and etc
Looking for $TICK divergences to inform SPY trades is an interesting strategy. For what it's worth though, about 15% of S&P 500 companies are Nasdaq-listed (with the rest listed on the NYSE). Thus, $TICK and SPY don't track the exact same basket, though I don't know how big of a difference that makes.
Oh absolutely. They were very small pushes, but valid indeed, setting up the retracement/reversal.
Good call!
Exactly! These are things most people don't see.
It takes seeing them in hindsight and then in real-time and having that “A-HA!” moment for the concept to sink in.
Yes, you could do that. The measuring move would be the top of the head to the neckline which is about $1.50 which is subtracted from the neckline which gives us about $89.50 which would also be gap support (or slightly beyond if the gap filled)
You know, I need to look into that more – thank you for bringing that up.
I need to see if the TICK is only good for following the NYSE Index (as a purist model). Not all TICK divergences materialize into reversals in the SPY or DIA but I attribute it to “there's no magic indicator”.
If anyone has any insight or thoughts on this, please feel free to share.