Intraday Bears Everywhere Except Bonds Monday
If you’re following Money Flow across the main markets this Monday morning, you’ll notice the bearish reactions in all main markets except one.
Let’s plot our quick intraday charts, note previous divergences, and make sense of what’s happening now.
We’ll start with a series of charts, beginning with the S&P 500 and Crude Oil:

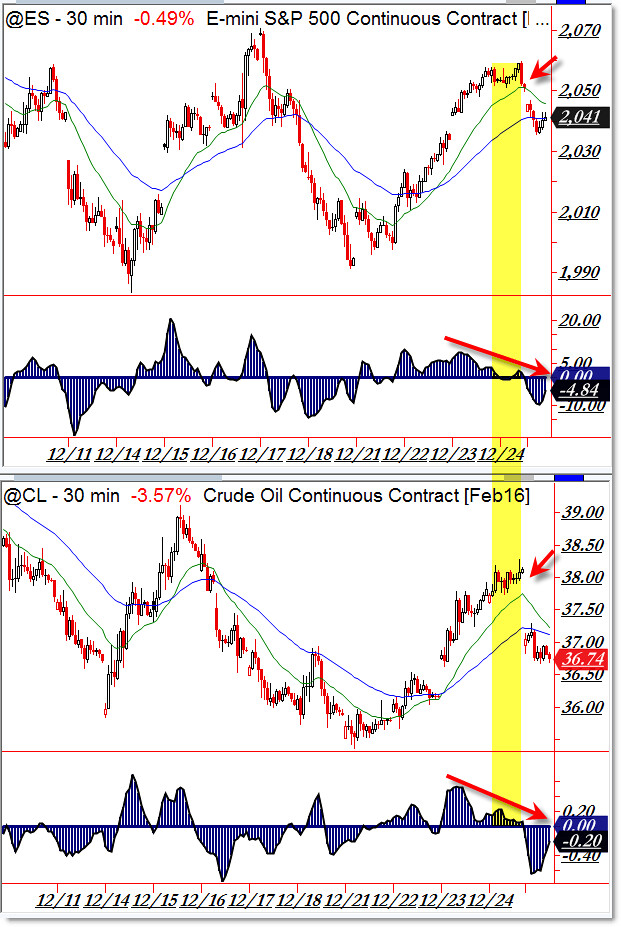
Both the S&P 500 (@ES futures) and Crude Oil (@CL) enjoyed the bullish “Santa Claus Rally” last week but they extended with clear negative momentum divergences Friday.
Today, we’re seeing the natural and logical pullback/retracment after an extended, divergent rally.
Oil declined particularly hard, falling over 3.5% mid-morning while stocks are off 0.5%.
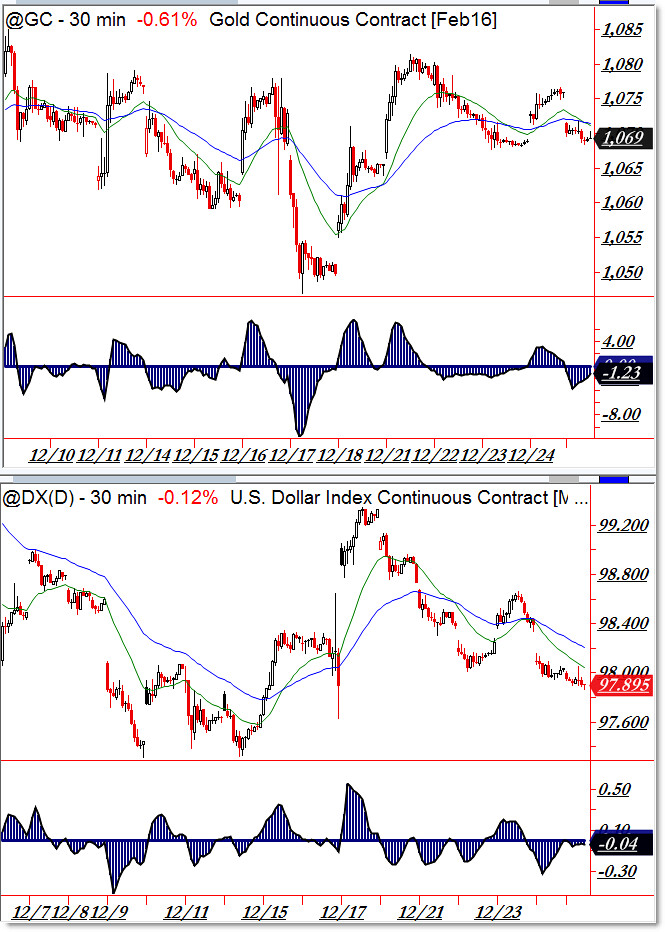
Next is fellow commodity Gold and the US Dollar Index (@GC and @DC):

We don’t see the dramatic rally nor the visual negative divergence in Gold and Oil.
Nevertheless, Gold snapped lower with a gap while the US Dollar Index gently declined, continuing the gap.
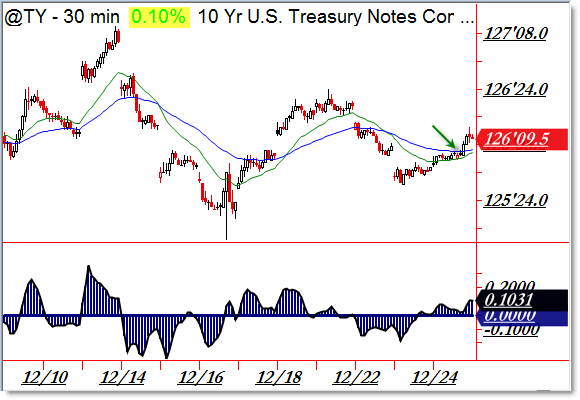
The only market of the “main five” Cross-Markets that we follow that’s bullish right now is Bonds:

Granted, a +0.10% gain is lackluster, but it’s the only green we’re seeing on the Main Market Grid.
Bonds rallied initially last week from a gap-down event and continued their bullish swing this morning.
Even if you don’t trade all (or most) of these markets, it’s important to get a sense of broader trends or events in money flow.
We’re mainly concerned with “Risk-ON” (offensive/bullish) or “Risk-OFF” (defensive/bearish) trends.
Right now, it’s clear that a defensive, Risk-Off retracment event is hitting the Cross-Market Landscape today.
Follow along with members of the Afraid to Trade Premium Membership for real-time updates and additional trade planning.
Corey Rosenbloom, CMT
Afraid to Trade.com
Follow Corey on Twitter: http://twitter.com/afraidtotrade
Corey’s book The Complete Trading Course (Wiley Finance) is now available along with the newly released Profiting from the Life Cycle of a Stock Trend presentation (also from Wiley).


It is really interesting to see these charts, as we
obviously get helped big time because of them and if we are able to analysis it
well then we obviously get performance rolling up greatly. I am not that great
at analyzing, but thanks to OctaFX broker with their daily market updates, I am
able to get all the important things right and also this blog helps a lot in
every possible manner, so that really gives my performance a big push.