Introducing New Chart Upgrade from Market Club
They’ve finally upgraded their charts! After a lengthy development phase, the Market Club service has upgraded their charting program and added some really interesting and amazing features. The charts are more interactive, more visually appealing, display multi-timeframe ‘trade triangle signals,’ display the rating “box” on the charts, and … the charts actually speak to you!
That’s right! Based on the composite score (based on inputs from indicators on different timeframes which generates a weighted score), each chart ‘speaks’ to you in terms of what the score means from a trend and opportunity standpoint.
Adam Hewison released a tutorial and overview ‘theater’ video that introduces these charts and walks you through the “talking chart” feature, Fibonacci tools, expanded indicators, trade triangle signals (now from multiple timeframes on the same chart), multi-market portfolio screen/scan, and other features.
Here is an example of the new charts:
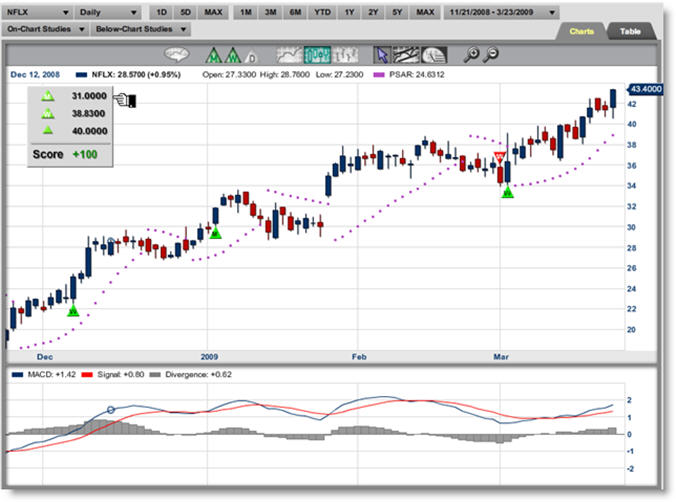
(clicking the chart opens a larger image for you to view)
One of the neater things about the new indicator list is the ability to use a slide-bar to change your indicator period settings. For example, instead of selecting 14 for an RSI and then changing it to a 10 period RSI and then a 5 period RSI, you can slide to see instant changes in what the indicator would register across different periods. That’s something I haven’t seen anywhere else. It works on the MACD, Bollinger Bands, and any of the other popular chart-based indicators.
As an affiliate member, they’ve let me demo these charts behind the scenes and I’m happy to announce this upgrade. I’m very impressed so far. View Adam’s video tutorial to see for yourself what the charts are like and as always check out whether Market Club (more information page) might be helpful to you as a developing trader.
I always want to show my appreciation to Adam and team for all the work they do for members and affiliates.
Cory !!!
Many of us are waiting on the updated elliot wave count on the S & P 500 . Please take your time but surely do suggest your intrepretation
Vasu,
I’ll try to do a couple of scenarios for tonight or tomorrow morning’s post. Breaking above 805 threw me for a loop!
Hi Corey ….
yeah, the break above the 805 put me too in the “dear in the headlight” kinda situation …lol .. anyways as always I had my stops at place. Anyways, I’m also waiting for your take on the Nifty after this strong rally, especially the EWT counts on it, as I’m very new at the EWT. And I want to thank you for introducing everyone of us to this new MACD indicator with 3,10,16 settings. I have been using it for past few days, and have relaized that it’s anyday better than the conventional MACD, and infact now I somewhat find your 3/10 indicator preforming better than the stochastics and RSI too. Thanks a lot, mate.
Regards,
Neil
The move back above 805 is rather strange for sure, but it would appear that we simply retraced roughly 61.8% of the (A) wave down with this (B) wave back up into the close.
Tomorrow’s first hour will be key!
…. and mate one more thing, though I have been using the divergences from a long time, and I know they work most of the times, I somewhere read about the hidden divergences, where its somewhat opposite to the regular or the normal divergences. Like … when the price makes a lower high and the oscillator makes higher high, and the price makes a higher low and the oscillator makes a lower low. This hidden divergence thing is very new to me, always knew the regular ones. I was wondering, maybe when you could find some spare time, you could throw some light on these hidden divergences. Thanks & Cheers
Neil,
What’s funny is that I rarely do swing trades (because of overnight gaps) but I was sooooo certain we’d hit major resistance at 805 that I got long the SDS and planned to hold for a test of the lows. And of course we get a big gap against me on Monday, showing me exactly why I shouldn’t stick my head out of the intraday timeframe!
Neil,
I love the 3/10 Oscillator. It’s probably most similar to a Rate of Change indicator or the indicator called “Momentum.” But the trend line (16 period) also gives some added benefits you can’t get from other oscillators. Plus, it’s unbounded (doesn’t travel in a range of 0-100 like almost all other oscillators) so that also makes it unique.
I call it a “Three in One” : A Momentum Oscillator, A Trend Indicator, and a Swing Indicator.
Thanks – I’m glad to have you as a reader!
Mike,
So many eyes are watching these levels and who (bulls/bears) are winning. It’s such an epic struggle that is throwing almost everyone off-balance.
We’ve gone so far up that we ‘need’ a retracement down, but we just can’t seem to get a meaningful down move.
Needless to say, that makes trading difficult. We’ve gone too far to get long (it seems), but we just can’t get a sustainable down move. Bulls just aren’t giving up!
Neil,
You’re on to something there – something I don’t discuss publicly because they’re difficult to explain.
The situation you describe can create a powerful move, some would call the “Slingshot Trade”
For me, I have trouble finding those in real-time and often only see them in hindsight. They’re quite rare but sometimes do lead to powerful moves that most people never see coming.