Johnson and Johnson JNJ Takes an Unexpected Turn
One would think everyday consumer staples stocks would at least hold their own during a recession but Johnson and Johnson (JNJ), who make numerous household products we use every day, suffered a significant downswing in price over the last two weeks, hinting that not even “very safe” stocks (to hedge with, or for those who have to be long stocks) aren’t even safe… which is a troubling prospect.
Johnson and Johnson (JNJ) Daily Chart:

In all fairness, price has been in a steady downtrend since its mid-2008 highs, and price has been remaining beneath all three key moving averages, and these averages have been in the most bearish orientation possible. It’s not *surprising* that a sudden down-draft in price happened, but it was harmful nonetheless to those who were trying to outperform the S&P by holding this stock in their portfolio as a safety stock.
Until the end of February, price had been supporting at the $54 level and had stayed in a relatively tight range (with around $58 as the high) which is exactly the behavior investors would expect from a ‘safe’ consumer staples stock, particularly one as large as JNJ.
Perhaps in a bear market, no stock is truly ‘safe,’ but then again, there are some (mutual) funds and accounts that are required to own stock.
Let’s see how JNJ has performed on its monthly chart, with a special focus on the 2007-present bear market.
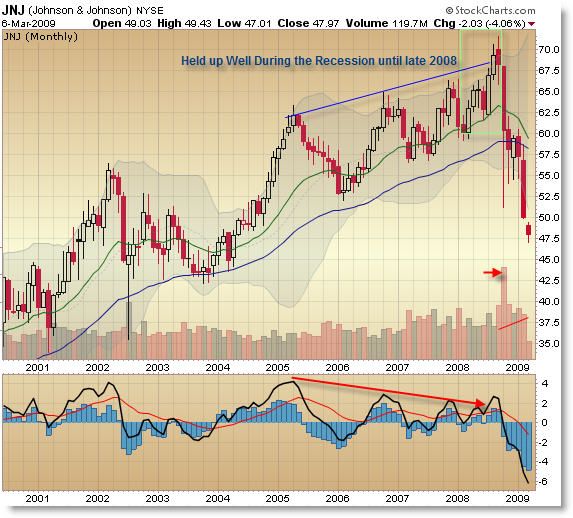
From 2007, the going was steadily up with rhythmic swings driving price to stable yet higher levels… again, behavior one would expect from a solid, non-exciting, safe investment. Price was supporting at the rising 20 month moving average and finding resistance above a key rising trendline.
In fact, in the middle of 2008 (before the October decline hit), investors had bid JNJ to new highs, breaking it out of the trend channel line and creating a large-scale buy signal.
Ultimately, that proved to be a devastating Bull Trap as price has fallen 30% from its break-out high. Price has since broken all moving average support and formed a large monthly New Momentum Low.
Johnson and Johnson’s price action may teach us that very, very few stocks can hold their own in a recessionary environment or bear market, and that the reach and depth of this bear market is exceedingly great.
(As an aside, I could have also shown a chart of consumer staples stock Proctor and Gamble, which shows a similar pattern to JNJ, particularly on the monthly chart).
Corey Rosenbloom
Afraid to Trade.com
Follow Corey on Twitter: http://twitter.com/afraidtotrade
Register (free) for the Afraid to Trade.com Blog to stay updated
Excellent analysis
It is the false breaks of the “obvious” which have proved so dramatic
True.
Particularly devastating in this case, considering how well people expect Consumer Staples to hold up in a downturn.
Yes, but for those who must be in equities, the relative perf chart shows that it still has been a relative winner:
http://stockcharts.com/h-sc/ui?s=JNJ:SPY&p=D&yr=1&mn=0&dy=0&id=p31020230432
Henry,
Agreed, but it – in my opinion – it shouldn’t have collapsed as quickly as it did. The RS line has certainly beat that of the S&P.
Maybe it would be best as a hedge, as in short SPY and long JNJ.
I’ve always found pairs trading interesting.